
SciChart:使用缩放模块无法工作
我正在使用SciChart库来显示图形。
我想知道,如何使用MouseWheelZoomModifier模块的SciChart库在我的纯HTML和CSS为基础的网站。
我知道有一个相关的文件可供反应,但我没有使用它在我的网站。
我已写了以下守则:
代码:
<!DOCTYPE html>
<html lang="en">
<head>
<!-- Required meta tags -->
<meta charset="utf-8" />
<meta name="viewport" content="width=device-width, initial-scale=1" />
<!-- Include SciChart.js -->
<script
src="https://cdn.jsdelivr.net/npm/scichart@2.1.2290/_wasm/scichart.browser.js"
crossorigin="anonymous"
></script>
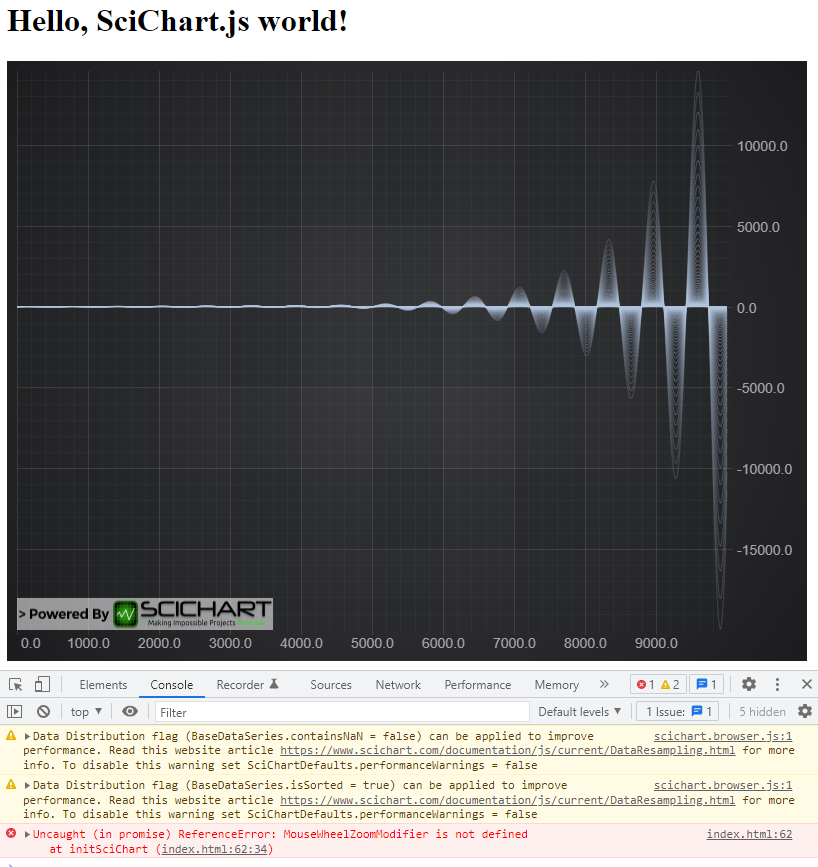
<title>Hello, SciChart.js world!</title>
</head>
<body>
<h1>Hello, SciChart.js world!</h1>
<!-- Create the Div to host the SciChartSurface -->
<div id="scichart-root" style="width: 800px; height: 600px;"></div>
<!-- The JavaScript to create a SciChartSurface -->
<script>
async function initSciChart() {
// In order to load data file from the CDN we need to set dataUrl
SciChart.SciChartSurface.configure({
dataUrl: `https://cdn.jsdelivr.net/npm/scichart@${SciChart.libraryVersion}/_wasm/scichart2d.data`,
wasmUrl: `https://cdn.jsdelivr.net/npm/scichart@${SciChart.libraryVersion}/_wasm/scichart2d.wasm`
});
// Create a SciChartSurface inside the div with id 'scichart-root'
const {
sciChartSurface,
wasmContext
} = await SciChart.SciChartSurface.create("scichart-root");
// Add an X and a Y Axis
const xAxis = new SciChart.NumericAxis(wasmContext);
sciChartSurface.xAxes.add(xAxis);
const yAxis = new SciChart.NumericAxis(wasmContext);
sciChartSurface.yAxes.add(yAxis);
// Create 100 dataseries, each with 10k points
for (let seriesCount = 0; seriesCount < 100; seriesCount++) {
const xyDataSeries = new SciChart.XyDataSeries(wasmContext);
const opacity = (1 - ((seriesCount / 120))).toFixed(2);
// Populate with some data
for(let i = 0; i < 10000; i++) {
xyDataSeries.append(i, Math.sin(i* 0.01) * Math.exp(i*(0.00001*(seriesCount+1))));
}
// Add and create a line series with this data to the chart
// Create a line series
const lineSeries = new SciChart.FastLineRenderableSeries(wasmContext, {
dataSeries: xyDataSeries,
stroke: `rgba(176,196,222,${opacity})`,
strokeThickness:2
});
sciChartSurface.renderableSeries.add(lineSeries);
}
// BELOW ONE NOT WORKING
// Add zoom, pan behaviours to the chart. Mousewheel zoom, panning and double-click to
// zoom to fit
const mouseWheelZoomModifier = new MouseWheelZoomModifier();
const zoomPanModifier = new ZoomPanModifier();
const rubberBandZoomModifier = new RubberBandXyZoomModifier();
const zoomExtentsModifier = new ZoomExtentsModifier();
sciChartSurface.chartModifiers.add(zoomExtentsModifier);
sciChartSurface.chartModifiers.add(zoomPanModifier);
sciChartSurface.chartModifiers.add(rubberBandZoomModifier);
sciChartSurface.chartModifiers.add(mouseWheelZoomModifier);
const inputEnablePan = document.getElementById("enable-pan");
const inputEnableZoom = document.getElementById("enable-zoom");
const inputEnableZoomToFit = document.getElementById("enable-zoom-to-fit");
const inputEnableMouseWheel = document.getElementById("enable-mouse-wheel-zoom");
inputEnablePan.addEventListener("input", (event) => {
zoomPanModifier.isEnabled = inputEnablePan.checked;
rubberBandZoomModifier.isEnabled = !inputEnablePan.checked;
inputEnableZoom.checked = !inputEnablePan.checked;
console.log(`Enabling Drag to Pan. Status: rubberBand checkbox ${inputEnableZoom.checked}, rubberBand ${rubberBandZoomModifier.isEnabled}, zoomPan checkbox ${inputEnablePan.isEnabled}, zoomPan ${zoomPanModifier.isEnabled} `);
});
inputEnableZoom.addEventListener("input", (event) => {
rubberBandZoomModifier.isEnabled = inputEnableZoom.checked;
zoomPanModifier.isEnabled = !inputEnableZoom.checked;
inputEnablePan.checked = !inputEnableZoom.checked;
console.log(`Enabling Drag to Zoom. Status: rubberBand checkbox ${inputEnableZoom.checked}, rubberBand ${rubberBandZoomModifier.isEnabled}, zoomPan checkbox ${inputEnablePan.isEnabled}, zoomPan ${zoomPanModifier.isEnabled} `);
});
inputEnableZoomToFit.addEventListener("input", (event) => {
zoomExtentsModifier.isEnabled = inputEnableZoomToFit.checked;
console.log("Enabling zoom extents");
});
inputEnableMouseWheel.addEventListener("input", (event) => {
mouseWheelZoomModifier.isEnabled = inputEnableMouseWheel.checked;
console.log("Enabling Mousewheel zoom");
});
}
initSciChart();
</script>
</body>
</html>输出:
MouseWheelZoomModifier实际上是在React教程中使用导入关键字导入的模块,但是我如何在基于HTML和CSS的网页中使用它。
帮帮忙吧。
回答 1
Stack Overflow用户
发布于 2022-04-27 13:21:58
因为您使用的是本机浏览器模块 (代码来自CDN和JS,而不是npm/webpack),所以您需要使用稍微不同的方式来声明代码中的对象。
注意,在使用浏览器包时,每个API调用都以
SciChart.为前缀。这是所有SciChart apis、函数和类型的全局命名空间。
一旦您添加了包含scichart.js (和版本)的脚本
<script src="https://cdn.jsdelivr.net/npm/scichart@2.1.2290/_wasm/scichart.browser.js" crossorigin="anonymous"></script>现在您必须告诉SciChart从哪里加载wasm文件。最简单的方法是调用SciChartSurface.useWasmFromCDN();
SciChart.SciChartSurface.useWasmFromCDN();接下来,当不使用npm/webpack时,SciChart库中的所有类型现在都以全局变量SciChart.为主。
例如,在我们的国家预防机制/webpack中记录了以下代码:
const mouseWheelZoomModifier = new MouseWheelZoomModifier();
sciChartSurface.chartModifiers.add(mouseWheelZoomModifier);
一定会变成这样
const mouseWheelZoomModifier = new SciChart.MouseWheelZoomModifier();
sciChartSurface.chartModifiers.add(mouseWheelZoomModifier);
或者,您也可以按以下方式预先声明这些类型:
// When using SciChart from CDN / browser bundle, there are no imports
// so either prepend every variable by global namespace SciChart.
// or use code like this to get the types out
const {
    MouseWheelZoomModifier,
    SciChartSurface,
    NumericAxis
} = SciChart;

// static func. Call once. load wasm from CDN
SciChartSurface.useWasmFromCDN();

// Create a SciChartSurface in <div id="div-id"/>
const { sciChartSurface, wasmContext } = SciChartSurface.create("div-id");

// Add x,y axis
sciChartSurface.xAxes.add(new NumericAxis(wasmContext));
sciChartSurface.yAxes.add(new NumericAxis(wasmContext));

// Add modifiers for zooming, panning
const mouseWheelZoomModifier = new MouseWheelZoomModifier();
sciChartSurface.chartModifiers.add(mouseWheelZoomModifier);
试一试,看看它是否有效
https://stackoverflow.com/questions/72008283
复制相似问题
腾讯云开发者

Copyright © 2013 - 2026 Tencent Cloud. All Rights Reserved. 腾讯云 版权所有
深圳市腾讯计算机系统有限公司 ICP备案/许可证号:粤B2-20090059 ![]() 粤公网安备44030502008569号
粤公网安备44030502008569号
腾讯云计算(北京)有限责任公司 京ICP证150476号 | 京ICP备11018762号