
ta.highest()和ta.highestbars()中“长度”参数(0.0)的pinescript错误值
ta.highest()和ta.highestbars()中“长度”参数(0.0)的pinescript错误值
提问于 2022-04-26 01:01:33
参考下面的代码,绘图temp1给出了错误,而绘制temp2绘图,好吗?任何建议
//@version=5
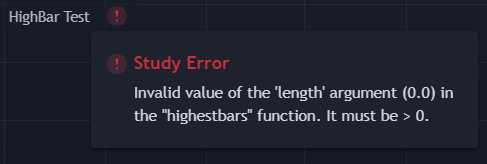
indicator("HighBar Test", overlay=false)
var temp1 = 0
var temp2 = 0
var length_1 = 0
var length_2 = 0
length_1 := bar_index - bar_index[50]
length_2 := 50
// eample 1
temp1 := ta.highestbars(length_1)
//plot(temp1)
// example 2
temp2 := ta.highestbars(length_2)
plot(temp2)
plot(length_2)回答 1
Stack Overflow用户
发布于 2022-04-26 18:00:45
运行时错误指示ta.highestbars()函数的length=参数值的问题,该值应该是高于零的整数值。
在图表的前49个条形图中,bar_index[50]调用将返回na,因为引用还不存在,因此bar_index - na == na注意,数学运算符不支持使用na值进行计算。您可以使用内置的nz()函数通过替换来保护它:
//@version=5
indicator("HighBar Test", overlay=false)
length_1 = bar_index - nz(bar_index[50], -1)
temp1 = ta.highestbars(length_1)
plot(temp1)页面原文内容由Stack Overflow提供。腾讯云小微IT领域专用引擎提供翻译支持
原文链接:
https://stackoverflow.com/questions/72007235
复制相关文章
相似问题
腾讯云开发者

Copyright © 2013 - 2026 Tencent Cloud. All Rights Reserved. 腾讯云 版权所有
深圳市腾讯计算机系统有限公司 ICP备案/许可证号:粤B2-20090059 ![]() 粤公网安备44030502008569号
粤公网安备44030502008569号
腾讯云计算(北京)有限责任公司 京ICP证150476号 | 京ICP备11018762号