
根据另一列计算列中出现的次数
根据另一列计算列中出现的次数
提问于 2022-04-24 19:09:44
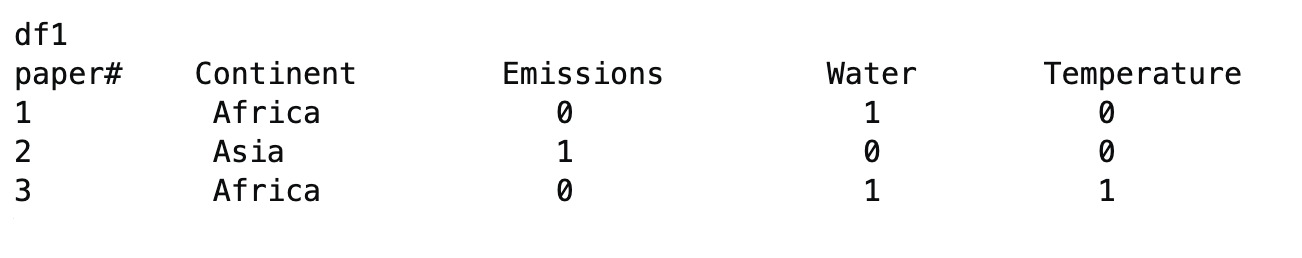
我在R中有一个数据,其中每一个观察都是一篇论文。“大陆”栏表示论文所关注的大陆,“影响”栏表示它提到的“影响”(0表示未提及)。
看起来是这样的:
我想做的是:
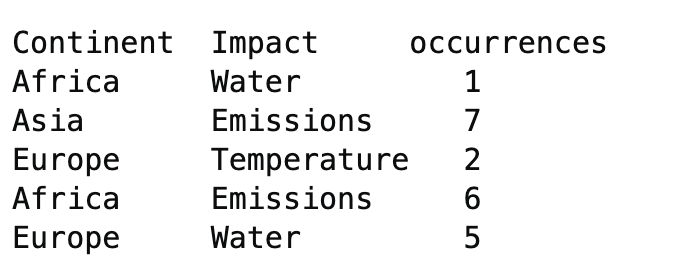
通过以下操作,我成功地生成了第二张图片中的数据:
water <- with(df,tapply(Water,Continent,FUN=sum))
colnames(water) <- "Water"

temp<- with(df,tapply(Temperature,Continent,FUN=sum))
colnames(temp) <- "Temperature")

new.df <- cbind(water,temp)
new.df2 <- cbind(newColName = rownames(new.df), new.df)
rownames(new.df) <- 1:nrow(new.df)


new.df2 <- melt(new.df2)
names(new.df2) <- c("Continent", "Impact", "Occurrences")
然而,我有50个专栏,我想要这样做,并正在努力寻找一个方法,可以简洁地做到这一点。总之,我想做的是找到一个简单的方法:
- 将每个“影响”列(除纸号和大陆栏外)由大陆列
- 熔化,以便对每个大陆和每个影响告诉我在该大陆
中出现的影响次数。
回答 1
Stack Overflow用户
发布于 2022-04-24 23:47:15
我认为tidyverse方法应该是这样的,但是如果不对一部分数据进行测试,很难确定:
tidyr::pivot_longer(
  df1,
  -c(`paper#`, Continent),
  names_to = "Impact",
  values_to = "Occurrences"
) %>%
  dplyr::group_by(Continent, Impact) %>%
dplyr::summarise(Occurrences = sum(Occurrences))页面原文内容由Stack Overflow提供。腾讯云小微IT领域专用引擎提供翻译支持
原文链接:
https://stackoverflow.com/questions/71991557
复制相关文章
相似问题
腾讯云开发者

Copyright © 2013 - 2026 Tencent Cloud. All Rights Reserved. 腾讯云 版权所有
深圳市腾讯计算机系统有限公司 ICP备案/许可证号:粤B2-20090059 ![]() 粤公网安备44030502008569号
粤公网安备44030502008569号
腾讯云计算(北京)有限责任公司 京ICP证150476号 | 京ICP备11018762号