
来自样本DataFrame的财务业绩和风险分析统计
来自样本DataFrame的财务业绩和风险分析统计
提问于 2022-04-24 11:43:14
如何从熊猫DataFrame样本中输出详细的财务业绩和风险分析统计数据?
有人能说明如何使用Quantstats、Pyfolio或其他类似的方法来实现这一点吗?
码
start_amount = 100000

np.random.seed(8)
win_loss_df = pd.DataFrame(
    np.random.choice([1000, -1000], 543),
    index=pd.date_range("2020-01-01", "2022-01-30", freq="B"),
    columns=["win_loss_amount"]
)
win_loss_df["total_profit"] = win_loss_df.win_loss_amount.cumsum() + start_amount
样品DataFrame
win_loss_df.head(10)

win_loss_amount total_profit
2020-01-01  -1000   99000
2020-01-02  1000    100000
2020-01-03  -1000   99000
2020-01-06  -1000   98000
2020-01-07  -1000   97000
2020-01-08  1000    98000
2020-01-09  1000    99000
2020-01-10  -1000   98000
2020-01-13  1000    99000
2020-01-14  -1000   98000
期望输出
我希望看到的产出包括:
- 年收益
- 夏普比
- 最大缩编
我希望为此使用一个库,这将简化流程,并返回类似于撕裂表的数据。
回答 2
Stack Overflow用户
回答已采纳
发布于 2022-04-28 02:58:05
我们将使用“利润”列并使用量子统计生成报告。
代码
import quantstats as qs
import numpy as np
import pandas as pd
start_amount = 100000
np.random.seed(8)
win_loss_df = pd.DataFrame(
np.random.choice([1000, -1000], 543),
index=pd.date_range("2020-01-01", "2022-01-30", freq="B"),
columns=["win_loss_amount"]
)
win_loss_df["total_profit"] = win_loss_df.win_loss_amount.cumsum() + start_amount
profit = win_loss_df.total_profit
# Save to image file, this image can also be seen in full report.
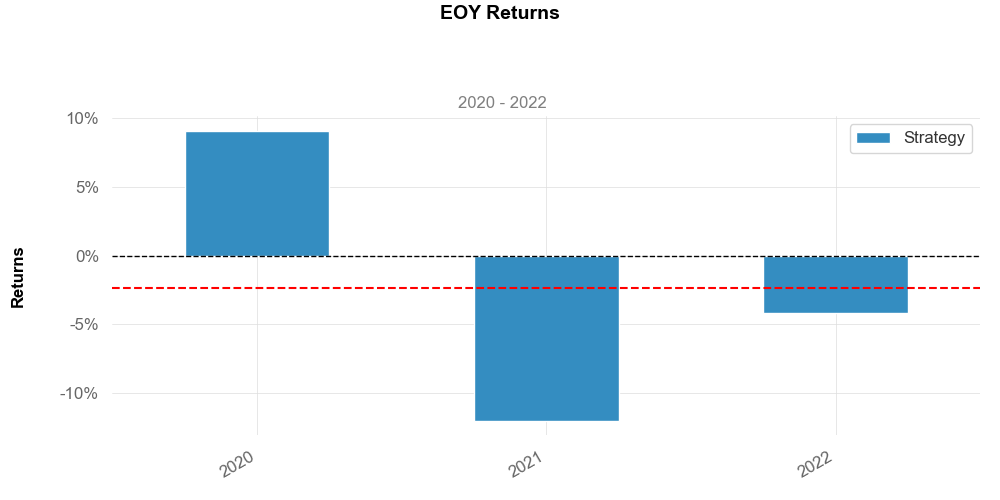
qs.plots.yearly_returns(profit, savefig='yearly_return.png')
print(f'montly returns:\n{qs.stats.monthly_returns(profit)}')
print(f'sharpe ratio: {qs.stats.sharpe(profit)}')
print(f'max markdown: {qs.stats.max_drawdown(profit)}')
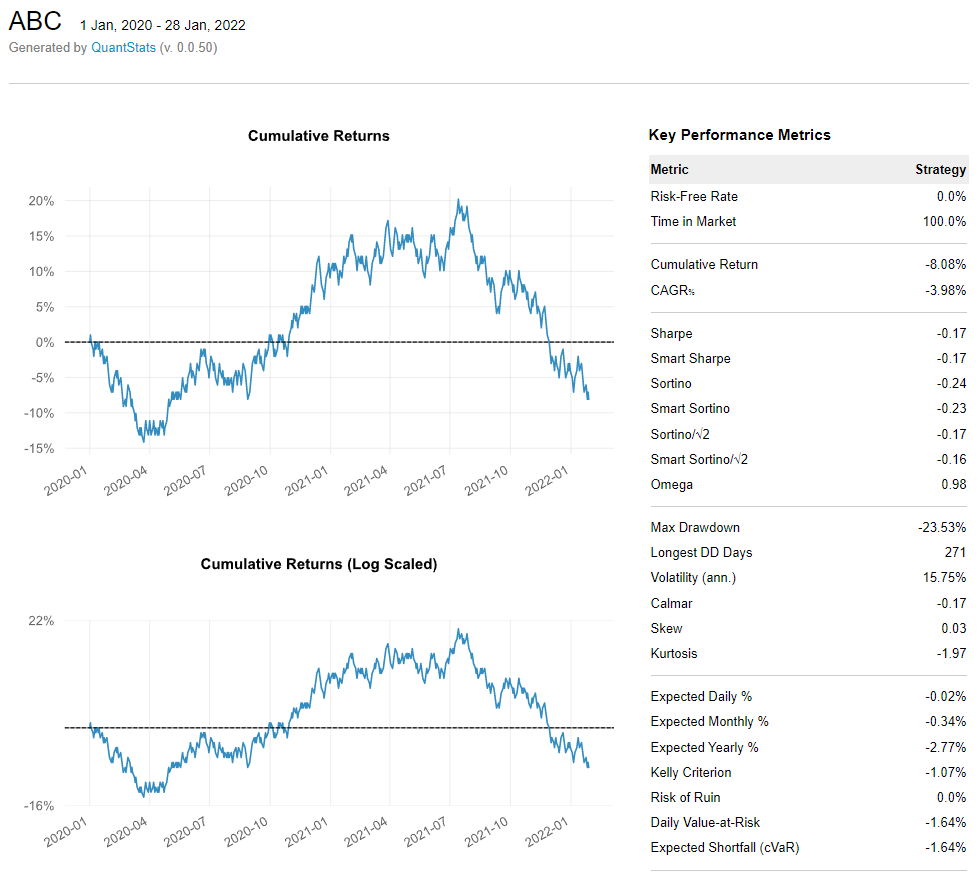
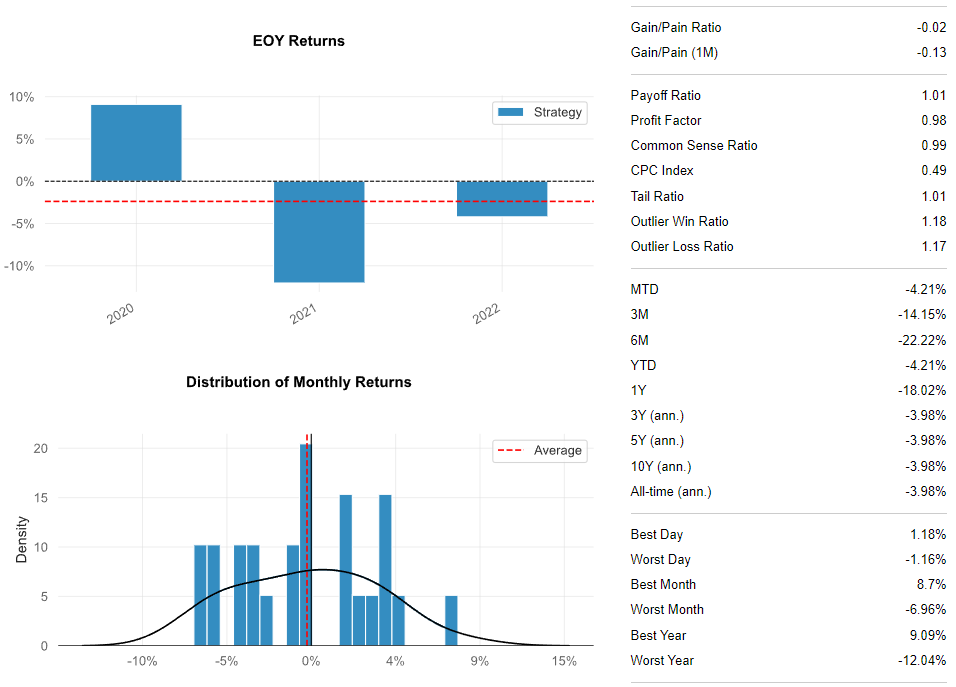
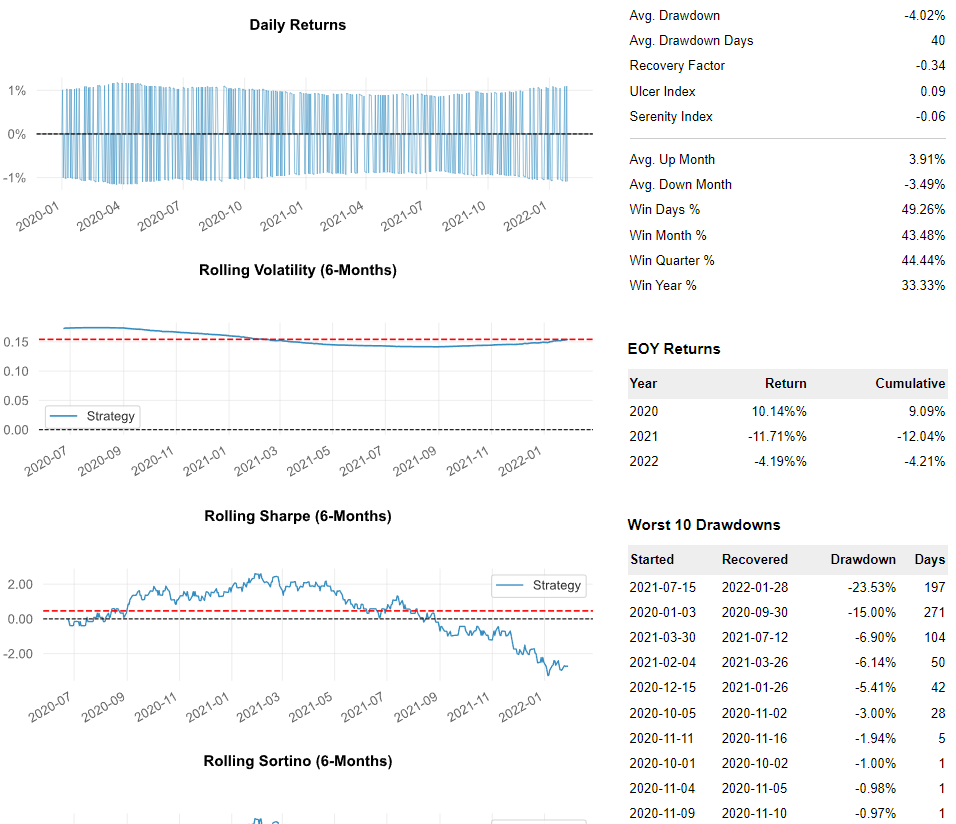
# Print full report in html.
qs.reports.html(profit, title='ABC', output='', download_filename='profit.html')输出
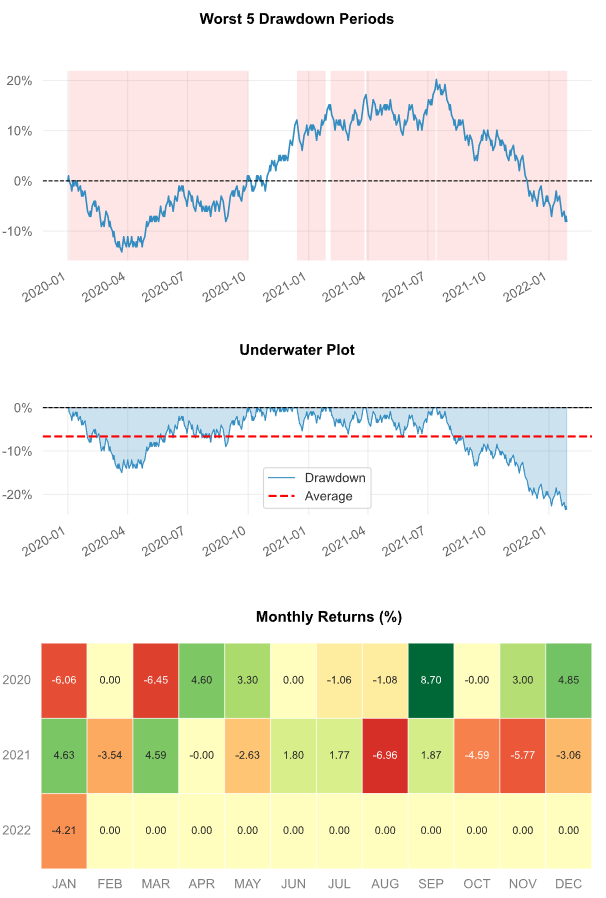
年收益
每月返回,夏普和标价
montly returns:
           JAN       FEB       MAR           APR       MAY       JUN       JUL       AUG       SEP           OCT       NOV       DEC       EOY
2020 -0.060606  0.000000 -0.064516  4.597701e-02  0.032967  0.000000 -0.010638 -0.010753  0.086957 -1.110223e-16  0.030000  0.048544  0.101444
2021  0.046296 -0.035398  0.045872 -4.440892e-16 -0.026316  0.018018  0.017699 -0.069565  0.018692 -4.587156e-02 -0.057692 -0.030612 -0.117146
2022 -0.042105  0.000000  0.000000  0.000000e+00  0.000000  0.000000  0.000000  0.000000  0.000000  0.000000e+00  0.000000  0.000000 -0.041881
sharpe ratio: -0.16968348978006012
max markdown: -0.23529411764705888
完整报告
profit.html
Stack Overflow用户
发布于 2022-04-24 11:53:16
使用量子统计。它有一套很好的度量标准。
页面原文内容由Stack Overflow提供。腾讯云小微IT领域专用引擎提供翻译支持
原文链接:
https://stackoverflow.com/questions/71988044
复制相关文章
相似问题
腾讯云开发者

Copyright © 2013 - 2026 Tencent Cloud. All Rights Reserved. 腾讯云 版权所有
深圳市腾讯计算机系统有限公司 ICP备案/许可证号:粤B2-20090059 ![]() 粤公网安备44030502008569号
粤公网安备44030502008569号
腾讯云计算(北京)有限责任公司 京ICP证150476号 | 京ICP备11018762号