
如何在matplotlib中的彩色地图上强制颜色?
我正在做一个0玩家的游戏,一个“生物”在地图周围移动吃食物以求生存,每一回合都消耗能量,吃食物增加能量。食物图是一个随机生成的二维块状阵列,每个位置上都有随机数量的食物。
food = np.random.randint(0, high=8, size=[10,10])当生物吃东西时,食物的价值就相应地降低了。
该生物是一个具有变量"id“、"energy”、"xpos“和"ypos”的对象。id是一个整数,它是该生物的“名称”。(我最终希望这个游戏有多个生物相互竞争。)
class Creature:
    def __init__(self, xpos,ypos, energy):
        self.id = 1
        self.xpos = xpos
        self.ypos = ypos
        self.energy = energy
该程序运行在一个循环中,每回合消耗生物1个能量点。如果它的能量低于某一值,它就会感到饥饿,并试图找到一个含有食物的位置,然后开始进食。当生物吃下食物时,这个位置的食物价值就会降低。
我正在尝试使用matplotlib可视化地显示这一点。我目前使用它来创建食物的热图,并单独创建一个网格,显示该生物的位置:
def colormap(data):
    fig, ax = plt.subplots()
    ax.imshow(data)
    ax.grid(which='major', axis='both', linestyle='-', color='k', linewidth=2)
    ax.set_xticks(np.arange(-.5, 10, 1));
    ax.set_yticks(np.arange(-.5, 10, 1));
    plt.show()
我想将生物的位置覆盖在食物地图的顶部,它的颜色与食物地图所用的颜色不同。
我被困在下一个要去的地方。也许matplotlib不是这里使用的合适工具。
下面是我用来生成两个不同网格的最小代码:一个显示地图上食物的值,另一个显示生物的位置。我希望该生物在食物地图上覆盖红色等颜色,而不管食物价值在那个位置的值是多少。
谢谢你的帮助,我意识到我可能在我的方法的基础上。
#Import modules
import random
import matplotlib.pyplot as plt
import numpy as np

#Create a heatmap grid from an array
def colormap(data):
    fig, ax = plt.subplots()
    ax.imshow(data)
    ax.grid(which='major', axis='both', linestyle='-', color='k', linewidth=2)
    ax.set_xticks(np.arange(-.5, 10, 1));
    ax.set_yticks(np.arange(-.5, 10, 1));
    plt.show()

#Creatue a new creature object
class Creature:
    def __init__(self,ID, xpos,ypos,energy):
        self.id = 1
        self.xpos = xpos
        self.ypos = ypos
        self.energy = energy


#Create the variables of that creature
xpos = random.randint(0,9)
ypos = random.randint(0,9)
energy = (10)


#Now that random attributes have been chosed and it has found a unique location, it spawns
newcreature = Creature(id,xpos,ypos,energy)

#Create an array to hold the ID of the creature occupying each space
occupant = np.full((10,10),0)

#creatue food map
food = np.random.randint(0, high=8, size=[10,10])


#Write the ID of the creature to the map of creature occupying that place in the map
occupant[newcreature.xpos,newcreature.ypos] = newcreature.id

#Display the food map
colormap(food)

#Display the creature map
colormap(occupant)回答 1
Stack Overflow用户
发布于 2022-04-23 09:46:24
如果每秒帧不困扰您,Matplotlib可能是此作业的工具。
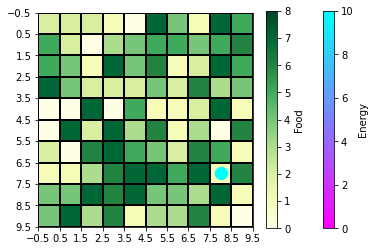
你非常接近你的目标:你需要使用一个食物地图的颜色图,和一个散点图来覆盖生物的位置(也用颜色图来表示能量水平)。下面是修改后的代码,我对其进行了注释,以使您更好地理解:
import random
import matplotlib.pyplot as plt
from matplotlib.colors import Normalize
import matplotlib.cm as cm
import numpy as np

#Create a heatmap grid from an array
def colormap(data, cmap_food, norm_food, pos, energy_cmap, norm_energy, current_energy):
    fig, ax = plt.subplots()
    img = ax.imshow(data, cmap=cmap_food, norm=norm_food)
    s = ax.scatter(*pos, s=150, cmap=energy_cmap, norm=norm_energy, c=current_energy, label="energy")
    ax.grid(which='major', axis='both', linestyle='-', color='k', linewidth=2)
    cb_energy = fig.colorbar(s)
    cb_energy.set_label("Energy", rotation=90)
    cb_food = fig.colorbar(img)
    cb_food.set_label("Food", rotation=90)
    ax.set_xticks(np.arange(-.5, 10, 1));
    ax.set_yticks(np.arange(-.5, 10, 1));
    plt.show()

#Creatue a new creature object
class Creature:
    def __init__(self,ID, xpos,ypos,energy):
        self.id = 1
        self.xpos = xpos
        self.ypos = ypos
        self.energy = energy


#Create the variables of that creature
xpos = random.randint(0,9)
ypos = random.randint(0,9)
energy = 10

#Now that random attributes have been chosed and it has found a unique location, it spawns
newcreature = Creature(id,xpos,ypos,energy)

#creatue food map
max_food = 8
food = np.random.randint(0, high=max_food, size=[10,10])

# colormap used to visualize food
# You can explore more colormaps at:
# https://matplotlib.org/stable/tutorials/colors/colormaps.html
cmap_food = cm.YlGn

# Normalize the colors
# If we think that the food colormap is too intesense, we can either
# change the food colormap, or increase vmax to a number greater than
# max_food.
# Maybe, we would like the minimum food location not to be white:
# then we can change vmin to a negative number.
norm_food = Normalize(vmin=0, vmax=max_food)

# Choose an appropriate colormap, one that should be visible at
# every energy/food level on top of the food colormap.
energy_cmap = cm.cool_r
# normalize the energy of the creature between the minimum and maximum
norm_energy = Normalize(vmin=0, vmax=energy)
# position of the creature
pos = (newcreature.xpos, newcreature.ypos)

#Display the food map
colormap(food, cmap_food, norm_food, pos, energy_cmap, norm_energy, newcreature.energy)
一旦您理解了这段代码,您就可以开始选择更好的colormaps,并在Normalize对象中设置更好的值。
https://stackoverflow.com/questions/71976261
复制相似问题
腾讯云开发者

Copyright © 2013 - 2026 Tencent Cloud. All Rights Reserved. 腾讯云 版权所有
深圳市腾讯计算机系统有限公司 ICP备案/许可证号:粤B2-20090059 ![]() 粤公网安备44030502008569号
粤公网安备44030502008569号
腾讯云计算(北京)有限责任公司 京ICP证150476号 | 京ICP备11018762号