
如何在向表格单元格中添加换行符时加入垂直行
如何在向表格单元格中添加换行符时加入垂直行
提问于 2022-04-20 01:10:35
我的代码如下:
\begin{table*}[!htbp]
\centering
\begin{tabular}{ |c|c|c|c|c|c|c| }
\hline
Models & Architecture & Val & Test Acc (FF) & Test Acc (BD) & Test Acc\\ \hline
VisualBert & Single Cross-Modal Transformer & 51.0\% & 50.8\% & 51.1\% & 50.5\% \\\\ \hline
VilBert & One Single Modal Transformer \\ & (Language) \\ & + one cross-modal transformer \\ & (with restricted attention pattern) & 51.2\% & 50.9\% & 51.2\% & 52.6\% \\\\ \hline
LXMERT & Two Single Modal Transformer \\ & (Vision and Language) \\ & + one cross-modal transformer \\ & (with restricted attention pattern) & 53.8\% & 52.2\% & 51.0\%& 52.9\% \\\\ \hline
Unicoder-VL & Single Cross-Modal Transformer & 53.8\% & 52.2\% & 51.0\%& 52.9\% \\\\ \hline
CLIP & Base Model: ResNet50 + \\ & masked self-attention transformer \\ & or \\ & ViT + text transformer & 53.8\% & 52.2\% & 51.0\%& 52.9\% \\\\ \hline
SLIP & ViT/B-16 and L-16 + \\ & text transformer from CLIP & 53.8\% & 52.2\% & 51.0\%& 52.9\% \\\\\hline
\end{tabular}
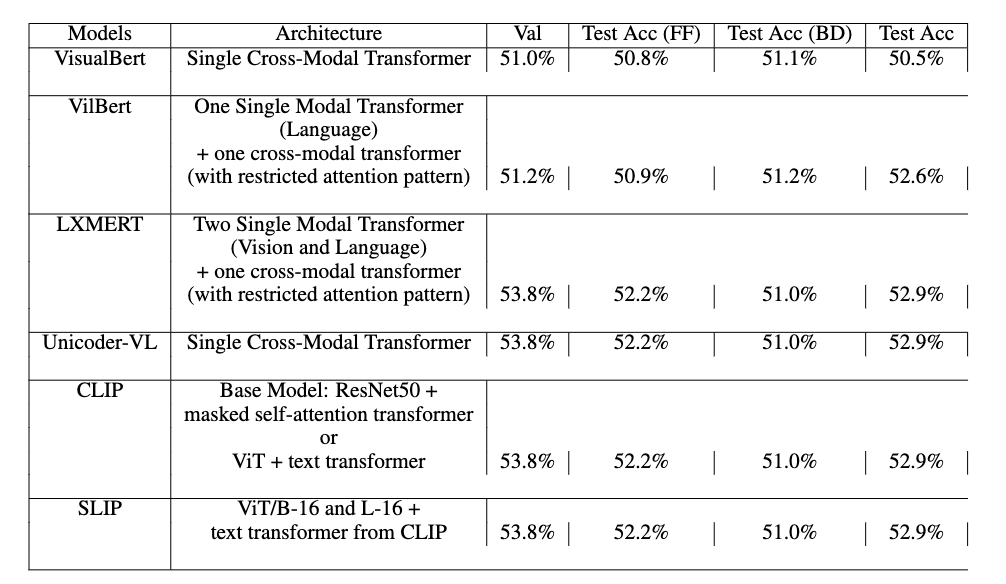
\caption{Model performance on Bongard LOGO on a reduced resolution. The test accuracy is reported on different dataset splits, including free-form shape test set (FF), basic shape test set (BA), combinatorial abstract shape test set (CM), and novel abstract shape test set (NV)}
\label{tab:baseline}
\end{table*}但这是我的输出:
如何完成垂直行并将第一列文本打印为底部对齐?请帮帮我!谢谢!
回答 1
Stack Overflow用户
回答已采纳
发布于 2022-04-20 08:17:14
前言:
不要在表格中使用垂直线。
(看一看https://wiert.files.wordpress.com/2014/04/zy8dkpa.gif,了解一些关于专业桌面的技巧)
\\不会为您的单元格添加换行,它将向您的表中添加完全新的行,并且您必须确保表的每一行都有相同数量的单元格。不要只是过早地用\\完成行,而是在必要时添加空单元格:
\documentclass{article}
\begin{document}
\begin{table*}[!htbp]
\centering
\begin{tabular}{ |c|c|c|c|c|c|c| }
\hline
Models & Architecture & Val & Test Acc (FF) & Test Acc (BD) & Test Acc\\\hline
VisualBert & Single Cross-Modal Transformer & 51.0\% & 50.8\% & 51.1\% & 50.5\% \\ \hline
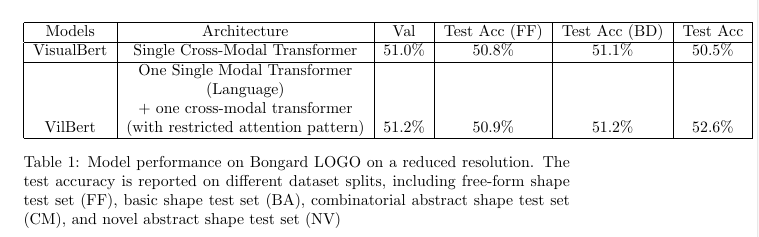
& One Single Modal Transformer &&&& \\ & (Language) &&&& \\ & + one cross-modal transformer &&&& \\ VilBert & (with restricted attention pattern) & 51.2\% & 50.9\% & 51.2\% & 52.6\% \\ \hline
\end{tabular}
\caption{Model performance on Bongard LOGO on a reduced resolution. The test accuracy is reported on different dataset splits, including free-form shape test set (FF), basic shape test set (BA), combinatorial abstract shape test set (CM), and novel abstract shape test set (NV)}
\label{tab:baseline}
\end{table*}
\end{document}
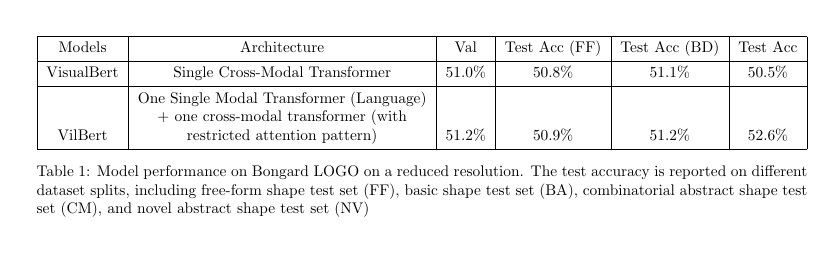
尽管如此,手动添加行中断似乎是不必要的乏味。我建议让乳胶帮你划线。对于tabularray包来说,这特别容易:
\documentclass{article}

\usepackage{tabularray}

\usepackage[hmargin=2cm]{geometry}

\begin{document}

\begin{table*}[!htbp]
\centering
\begin{tblr}{ |c|X[valign=b,halign=c]|c|c|c|c|c| }
 \hline
 Models &  Architecture & Val & Test Acc (FF)  & Test Acc (BD) & Test Acc\\\hline
 VisualBert  & Single Cross-Modal Transformer & 51.0\% & 50.8\% &  51.1\% & 50.5\% \\ \hline
 VilBert & One Single Modal Transformer (Language) + one cross-modal transformer (with restricted attention pattern) & 51.2\% & 50.9\% & 51.2\% &  52.6\%  \\ \hline
\end{tblr}
\caption{Model performance on Bongard LOGO on a reduced resolution. The test accuracy is reported on different dataset splits, including free-form shape test set (FF), basic shape test set (BA), combinatorial abstract shape test set (CM), and novel abstract shape test set (NV)}
\label{tab:baseline}
\end{table*}

\end{document}
页面原文内容由Stack Overflow提供。腾讯云小微IT领域专用引擎提供翻译支持
原文链接:
https://stackoverflow.com/questions/71933019
复制相关文章
相似问题
腾讯云开发者

Copyright © 2013 - 2026 Tencent Cloud. All Rights Reserved. 腾讯云 版权所有
深圳市腾讯计算机系统有限公司 ICP备案/许可证号:粤B2-20090059 ![]() 粤公网安备44030502008569号
粤公网安备44030502008569号
腾讯云计算(北京)有限责任公司 京ICP证150476号 | 京ICP备11018762号