
使用rstatix::wilcox_test()、rstatix::add_xy_position()和ggpubr::stat_pvalue_manual(),p值位置被错误地定义为零
使用rstatix::wilcox_test()、rstatix::add_xy_position()和ggpubr::stat_pvalue_manual(),p值位置被错误地定义为零
提问于 2022-04-15 20:59:01
在对我的数据执行rstatix::wilcox_test()之后,我自动添加了y.position值,以便使用rstatix::add_xy_position()绘制p值。然后,我绘制了数据并使用ggpubr::stat_pvalue_manual()添加了p值。问题是,y.position值被错误地定义为零,导致所绘制的p值和括号geom出现在y-轴底部的零位置,而此时它应该出现在y-轴顶部附近。rstatix的文档表明,按max默认设置计算的y.position值应该等于max(data$Response) = 0.00008556344,而不是零。我是不是不正确地使用这些函数?如果不是,如何才能使p值和括号geom出现在对应于最大值的y轴数据值上?
library(tidyverse)
library(rstatix)
library(ggpubr)

# minimal data example
data <- tibble::tribble(
  ~Group,       ~Response,
  "Treatment",  3.210486e-06,
  "Control",    4.006825e-06,
  "Treatment",  4.350836e-06,
  "Control",    4.216934e-06,
  "Treatment",  4.415194e-06,
  "Control",    1.0260606e-05,
  "Treatment",  1.111064e-06,
  "Control",    1.0779088e-05,
  "Treatment",  3.57185e-07,
  "Control",    1.139097e-06,
  "Treatment",  0,
  "Control",    2.31074e-07,
  "Treatment",  5.78956e-07,
  "Control",    4.371157e-06,
  "Treatment",  6.5825e-08,
  "Control",    9.587202e-06,
  "Treatment",  2.65383e-07,
  "Control",    3.57337e-06,
  "Treatment",  7.14146e-07,
  "Control",    3.868605e-06,
  "Treatment",  1.2213951e-05,
  "Control",    6.936899e-06,
  "Treatment",  4.71707e-07,
  "Control",    5.5957173e-05,
  "Treatment",  1.265942e-06,
  "Control",    8.5563441e-05,
  "Treatment",  0,
  "Control",    0,
  "Treatment",  0,
  "Control",    2.1306289e-05,
  "Treatment",  5.2055e-07,
  "Control",    1.8420094e-05
)

# performing Wilcoxon test and adding 'y.position' for the p value
wilcoxon_result <- data %>%
  wilcox_test(Response ~ Group) %>%
  add_xy_position("Group")

# the 'y.position' is incorrectly defined as zero.
wilcoxon_result
#> # A tibble: 1 × 11
#>   .y.      group1  group2     n1    n2 statistic       p y.position groups  xmin
#>   <chr>    <chr>   <chr>   <int> <int>     <dbl>   <dbl>      <dbl> <name> <dbl>
#> 1 Response Control Treatm…    16    16      206. 0.00326          0 <chr>      1
#> # … with 1 more variable: xmax <dbl>

# the p value and bracket geom are plotted at zero.
ggplot(data, aes(Group, Response)) +
  stat_summary(geom = "errorbar", fun.data = mean_cl_boot, width = 0.25) +
  stat_summary(geom = "crossbar", fun = mean, fun.min = mean, fun.max = mean, fatten = FALSE, width = 0.5) +
  stat_pvalue_manual(wilcoxon_result, "P = {p}", size = 18 / ggplot2::.pt, tip.length = 0, bracket.size = 2 / ggplot2::.stroke) +
  theme_pubr(base_size = 18, x.text.angle = 45)

回答 1
Stack Overflow用户
回答已采纳
发布于 2022-04-15 21:25:18
似乎你的y位被四舍五入为零,因为你处理的是非常小的数字。如果将响应变量乘以100万,则得到相同的p值,然后可以将y位置除以使其位于任何您想要的位置:
# performing Wilcoxon test and adding 'y.position' for the p value
wilcoxon_result <- data %>%
  mutate(Response = Response * 1e6) %>%
  wilcox_test(Response ~ Group) %>%
  add_xy_position("Group") %>%
  mutate(y.position = y.position /3e6)
这意味着:
wilcoxon_result
#> # A tibble: 1 x 11
#> .y. group1 group2 n1 n2 statistic p y.position groups xmin xmax
#> <chr> <chr> <chr> <int> <int> <dbl> <dbl> <dbl> <named list> <dbl> <dbl>
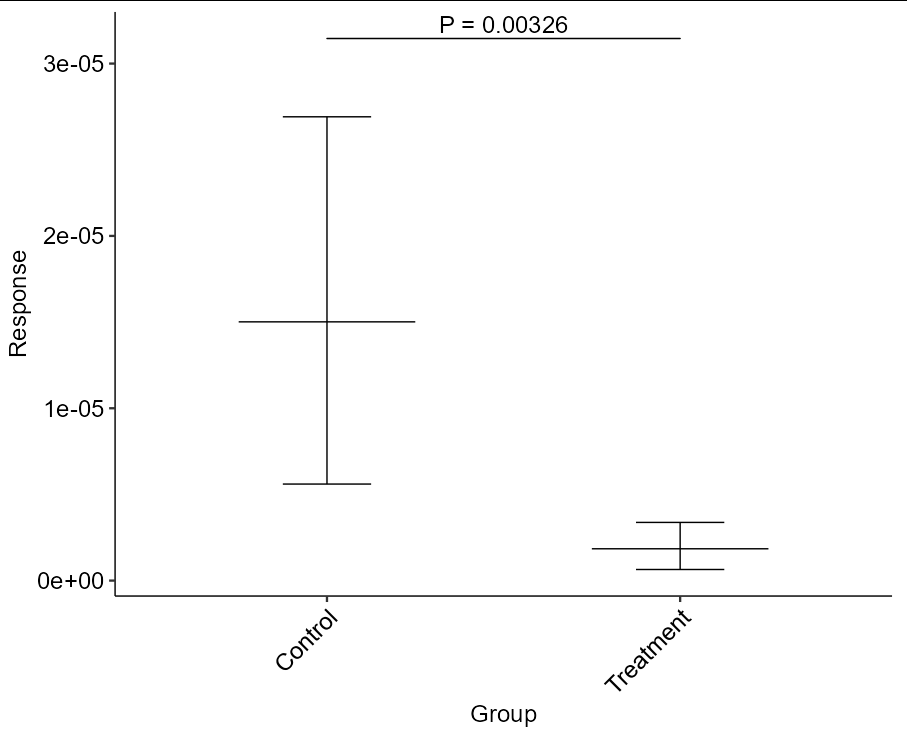
#> Response Control Treatment 16 16 206. 0.00326 0.0000315 <chr [2]> 1 2情节是这样的:
ggplot(data, aes(Group, Response)) +
  stat_summary(geom = "errorbar", fun.data = mean_cl_boot, width = 0.25) +
  stat_summary(geom = "crossbar", fun = mean, fun.min = mean,
               fun.max = mean, fatten = FALSE, width = 0.5) +
  stat_pvalue_manual(wilcoxon_result, "P = {p}",
                     size = 18 / ggplot2::.pt, tip.length = 0,
                     bracket.size = 2 / ggplot2::.stroke) +
  theme_pubr(base_size = 18, x.text.angle = 45)
页面原文内容由Stack Overflow提供。腾讯云小微IT领域专用引擎提供翻译支持
原文链接:
https://stackoverflow.com/questions/71888899
复制相关文章
相似问题
腾讯云开发者

Copyright © 2013 - 2026 Tencent Cloud. All Rights Reserved. 腾讯云 版权所有
深圳市腾讯计算机系统有限公司 ICP备案/许可证号:粤B2-20090059 ![]() 粤公网安备44030502008569号
粤公网安备44030502008569号
腾讯云计算(北京)有限责任公司 京ICP证150476号 | 京ICP备11018762号