
为什么我的两个d3.js图没有合并在一个页面中?
为什么我的两个d3.js图没有合并在一个页面中?
提问于 2022-04-14 16:22:11
我分别在条形图和饼形图的单独页面上做了两个单独的图,现在我想将这两个图组合在一个页面中,这样我就可以有一个仪表板了。但是当我开始将主页面中的两幅图组合起来时,这是不可能的,它们相互重叠。代码:
https://github.com/Mustafa2911/d3-design/blob/main/combine.html
合并文件包含:饼图和条形图的代码。条形图文件包含:条形图代码。饼图包含:饼图代码。
回答 1
Stack Overflow用户
回答已采纳
发布于 2022-04-14 20:42:21
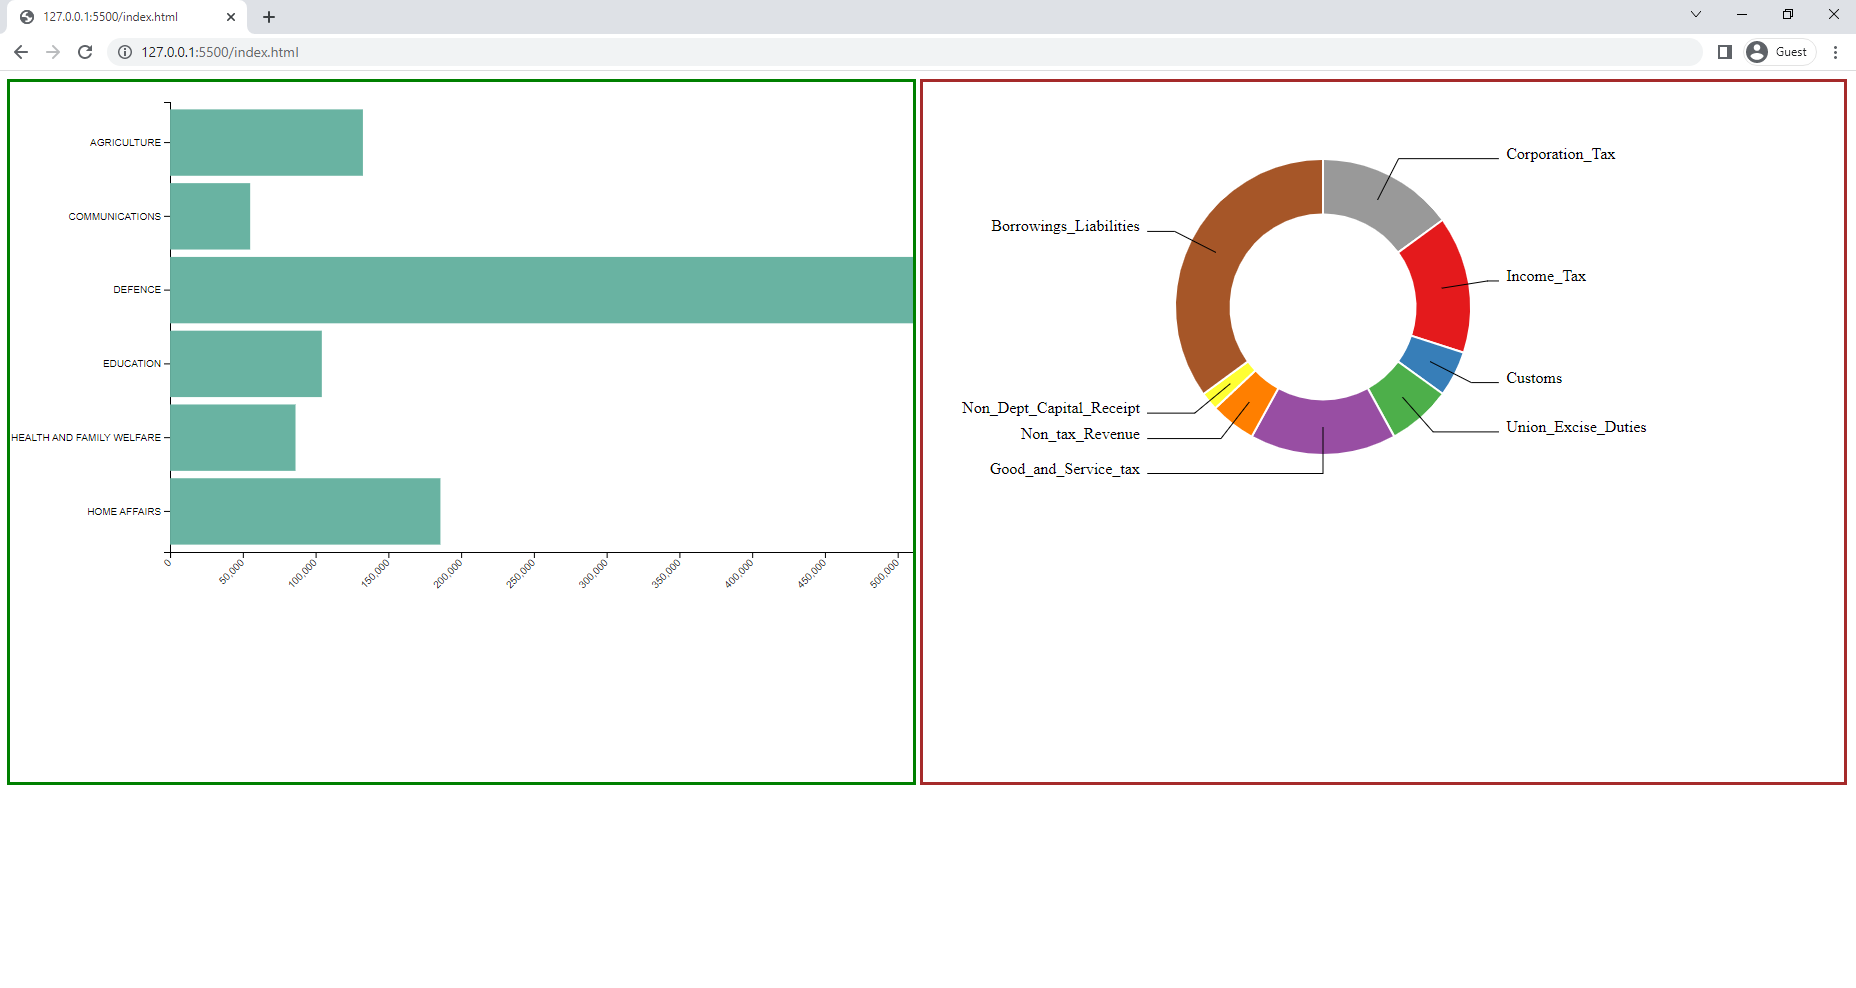
用你的密码试过了。滚动以查看条形图轴。
注意:条形图数据将不可用∵,它来自存储库中的demo1.csv文件。
希望这能有所帮助。
<!DOCTYPE html>
<meta charset="utf-8">

<head>
  <!-- Load d3.js -->
  <script src="https://d3js.org/d3.v4.js"></script>
  <script src="https://d3js.org/d3-scale-chromatic.v1.min.js"></script>
  <style>
    #my_dataviz {
      display: inline-block;
      width: 50%;
    }
  </style>
</head>

<body>
  <div id="my_dataviz"></div>
  <script>
    // set the dimensions and margins of the graph
    var width = 800
    height = 450
    margin = 40
    // The radius of the pieplot is half the width or half the height (smallest one). I subtract a bit of margin.
    var radius = Math.min(width, height) / 2 - margin
    // append the svg object to the div called 'my_dataviz'
    var svg = d3.select("#my_dataviz")
      .append("svg")
      .attr("width", width)
      .attr("height", height)
      .append("g")
      .attr("transform", "translate(" + width / 2 + "," + height / 2 + ")");
    // Create dummy data
    var data = {
      Corporation_Tax: 15,
      Income_Tax: 15,
      Customs: 5,
      Union_Excise_Duties: 7,
      Good_and_Service_tax: 16,
      Non_tax_Revenue: 5,
      Non_Dept_Capital_Receipt: 2,
      Borrowings_Liabilities: 35
    }
    // set the color scale
    var color = d3.scaleOrdinal()
      .domain(["a", "b", "c", "d", "e", "f", "g", "h"])
      .range(d3.schemeSet1);
    // Compute the position of each group on the pie:
    var pie = d3.pie()
      .sort(null) // Do not sort group by size
      .value(function(d) {
        return d.value;
      })
    var data_ready = pie(d3.entries(data))
    // The arc generator
    var arc = d3.arc()
      .innerRadius(radius * 0.5) // This is the size of the donut hole
      .outerRadius(radius * 0.8)
    // Another arc that won't be drawn. Just for labels positioning
    var outerArc = d3.arc()
      .innerRadius(radius * 0.9)
      .outerRadius(radius * 0.9)
    // Build the pie chart: Basically, each part of the pie is a path that we build using the arc function.
    svg
      .selectAll('allSlices')
      .data(data_ready)
      .enter()
      .append('path')
      .attr('d', arc)
      .attr('fill', function(d) {
        return (color(d.data.key))
      })
      .attr("stroke", "white")
      .style("stroke-width", "2px")
      .style("opacity", 1)
    // Add the polylines between chart and labels:
    svg
      .selectAll('allPolylines')
      .data(data_ready)
      .enter()
      .append('polyline')
      .attr("stroke", "black")
      .style("fill", "none")
      .attr("stroke-width", 1)
      .attr('points', function(d) {
        var posA = arc.centroid(d) // line insertion in the slice
        var posB = outerArc.centroid(d) // line break: we use the other arc generator that has been built only for that
        var posC = outerArc.centroid(d); // Label position = almost the same as posB
        var midangle = d.startAngle + (d.endAngle - d.startAngle) / 2 // we need the angle to see if the X position will be at the extreme right or extreme left
        posC[0] = radius * 0.95 * (midangle < Math.PI ? 1 : -1); // multiply by 1 or -1 to put it on the right or on the left
        return [posA, posB, posC]
      })
    // Add the polylines between chart and labels:
    svg
      .selectAll('allLabels')
      .data(data_ready)
      .enter()
      .append('text')
      .text(function(d) {
        console.log(d.data.key);
        return d.data.key
      })
      .attr('transform', function(d) {
        var pos = outerArc.centroid(d);
        var midangle = d.startAngle + (d.endAngle - d.startAngle) / 2
        pos[0] = radius * 0.99 * (midangle < Math.PI ? 1 : -1);
        return 'translate(' + pos + ')';
      })
      .style('text-anchor', function(d) {
        var midangle = d.startAngle + (d.endAngle - d.startAngle) / 2
        return (midangle < Math.PI ? 'start' : 'end')
      })
  </script>

  <style>
    #my_dataviz {
      display: inline-block;
      width: 50%;
    }
  </style>
  <div id="my_dataviz_es"></div>
  <script>
    // set the dimensions and margins of the graph
    var margin = {
        top: 20,
        right: 30,
        bottom: 40,
        left: 160
      },
      width = 460,
      height = 400;
    // append the svg object to the body of the page
    var svg = d3.select("#my_dataviz_es")
      .append("svg")
      .attr("width", width + margin.left + margin.right)
      .attr("height", height + margin.top + margin.bottom)
      .append("g")
      .attr("transform",
        "translate(" + margin.left + "," + margin.top + ")");
    // Parse the Data
    d3.csv("demo1.csv", function(data) {
      // Add X axis
      var x = d3.scaleLinear()
        .domain([0, 550000])
        .range([0, width]);
      svg.append("g")
        .attr("transform", "translate(0," + height + ")")
        .call(d3.axisBottom(x))
        .selectAll("text")
        .attr("transform", "translate(-10,0)rotate(-45)")
        .style("text-anchor", "end");
      // Y axis
      var y = d3.scaleBand()
        .range([0, height])
        .domain(data.map(function(d) {
          return d.Country;
        }))
        .padding(.1);
      svg.append("g")
        .call(d3.axisLeft(y))
      //Bars
      svg.selectAll("myRect")
        .data(data)
        .enter()
        .append("rect")
        .attr("x", x(0))
        .attr("y", function(d) {
          return y(d.Country);
        })
        .attr("width", function(d) {
          return x(d.Value);
        })
        .attr("height", y.bandwidth())
        .attr("fill", "#69b3a2")
      // .attr("x", function(d) { return x(d.Country); })
      // .attr("y", function(d) { return y(d.Value); })
      // .attr("width", x.bandwidth())
      // .attr("height", function(d) { return height - y(d.Value); })
      // .attr
    })
  </script>

</body>

</html>
编辑:参见这里- https://codepen.io/KZJ/pen/rNpqvdq?editors=1011 -有关所做的更改。以下评论
,如果我想把我的条形图放在顶部和右边,我想要我的饼图。
变了-
两个图表都使用相同的名称'svg‘进行d3。选择()div。这导致了图表的重叠。
( b)修改的宽度、高度、转换和添加一些边框CSS --仅为演示目的--可以根据需要删除/编辑。
现在看起来是这样的-
页面原文内容由Stack Overflow提供。腾讯云小微IT领域专用引擎提供翻译支持
原文链接:
https://stackoverflow.com/questions/71874770
复制相关文章
相似问题
腾讯云开发者

Copyright © 2013 - 2026 Tencent Cloud. All Rights Reserved. 腾讯云 版权所有
深圳市腾讯计算机系统有限公司 ICP备案/许可证号:粤B2-20090059 ![]() 粤公网安备44030502008569号
粤公网安备44030502008569号
腾讯云计算(北京)有限责任公司 京ICP证150476号 | 京ICP备11018762号