
sjPlot:如何指定因变量?
sjPlot:如何指定因变量?
提问于 2022-04-13 16:31:25
关于sjPlot,plot_models函数,我有一个简短的问题。
我有这样的代码:
fit1 <- lm(mpg ~ wt + cyl + disp + gear, data = mtcars)
fit2 <- update(fit1, . ~ . + hp)
fit3 <- update(fit2, . ~ . + am)


fit4 <- lm(hp ~ wt + cyl + disp + gear, data = mtcars)
fit5 <- update(fit4, . ~ . + hp)
fit6 <- update(fit5, . ~ . + am)


fit7 <- lm(cyl ~ wt + cyl + disp + gear, data = mtcars)
fit8 <- update(fit7, . ~ . + hp)
fit9 <- update(fit8, . ~ . + am)


plot_models(fit1, fit2, fit3, fit4, fit5, fit6, fit7, fit8, fit9,std.est = "std2")
这会产生以下结果:
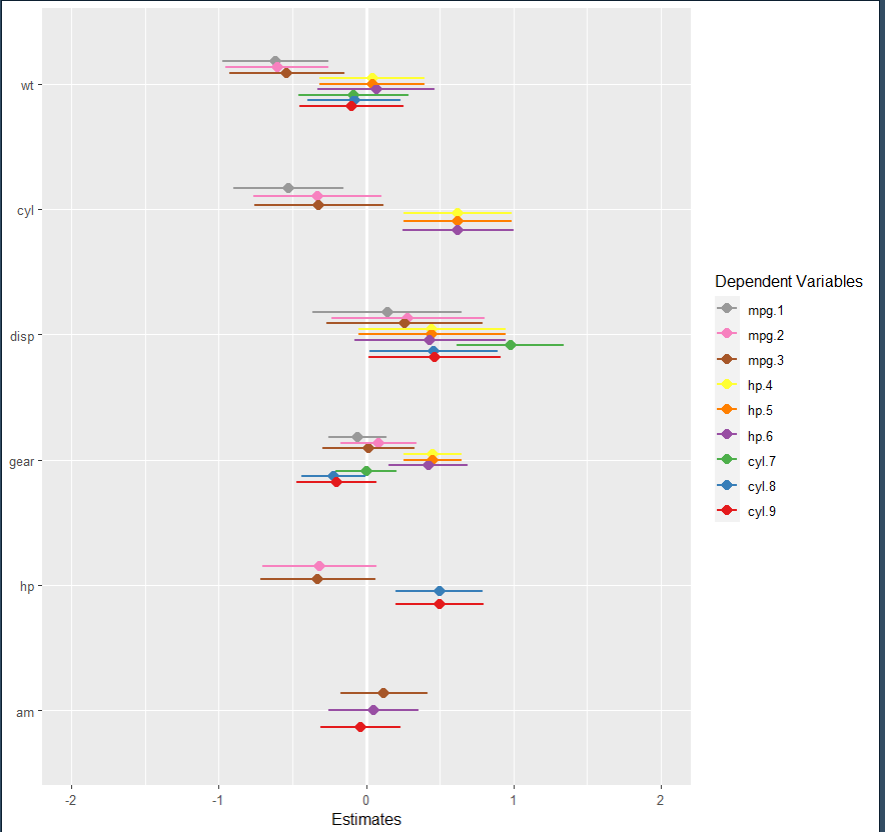
如何在估计图中编码所有将MPG称为蓝色的因变量、将hp称为绿色的所有因变量以及将cyl称为黄色的所有因变量?那么标签应该相应更新吗?
回答 1
Stack Overflow用户
回答已采纳
发布于 2022-04-13 19:32:20
您可以使用ggplot命令来调整颜色:
plot_models(fit1, fit2, fit3, fit4, fit5, fit6, fit7, fit8, fit9, std.est = "std2") +
scale_color_manual(values = c("mpg.1" = "dodgerblue",
"mpg.2" = "dodgerblue3",
"mpg.3" = "blue",
"hp.4" = "yellow",
"hp.5" = "yellow2",
"hp.6" = "gold2",
"cyl.7" = "chartreuse",
"cyl.8" = "springgreen4",
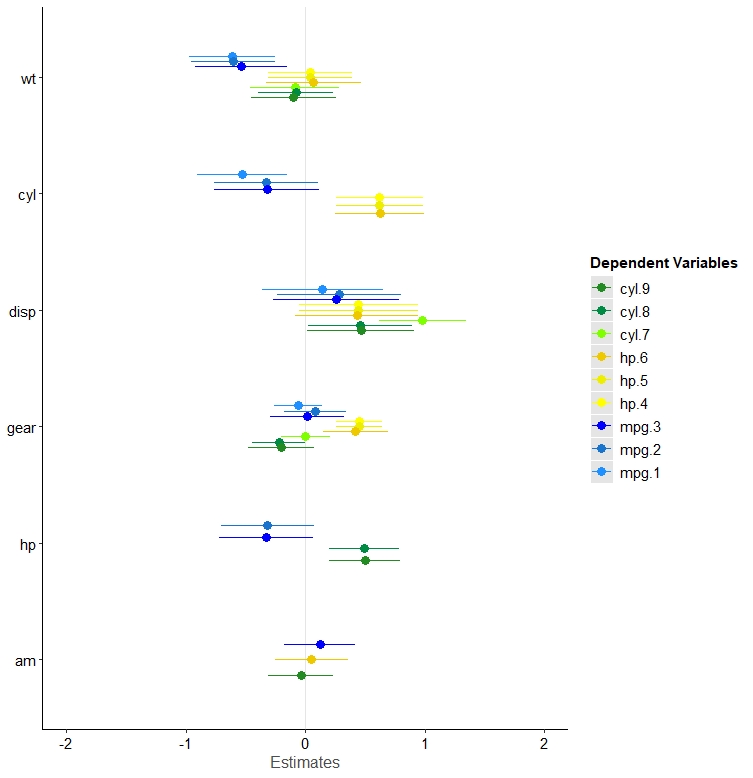
"cyl.9" = "forestgreen"))正如您所看到的,这些子类型之间的区别不是很好。
页面原文内容由Stack Overflow提供。腾讯云小微IT领域专用引擎提供翻译支持
原文链接:
https://stackoverflow.com/questions/71860894
复制相关文章
相似问题
腾讯云开发者

Copyright © 2013 - 2026 Tencent Cloud. All Rights Reserved. 腾讯云 版权所有
深圳市腾讯计算机系统有限公司 ICP备案/许可证号:粤B2-20090059 ![]() 粤公网安备44030502008569号
粤公网安备44030502008569号
腾讯云计算(北京)有限责任公司 京ICP证150476号 | 京ICP备11018762号