
使用color_discrete_map不改变颜色
使用color_discrete_map不改变颜色
提问于 2022-04-13 14:59:36
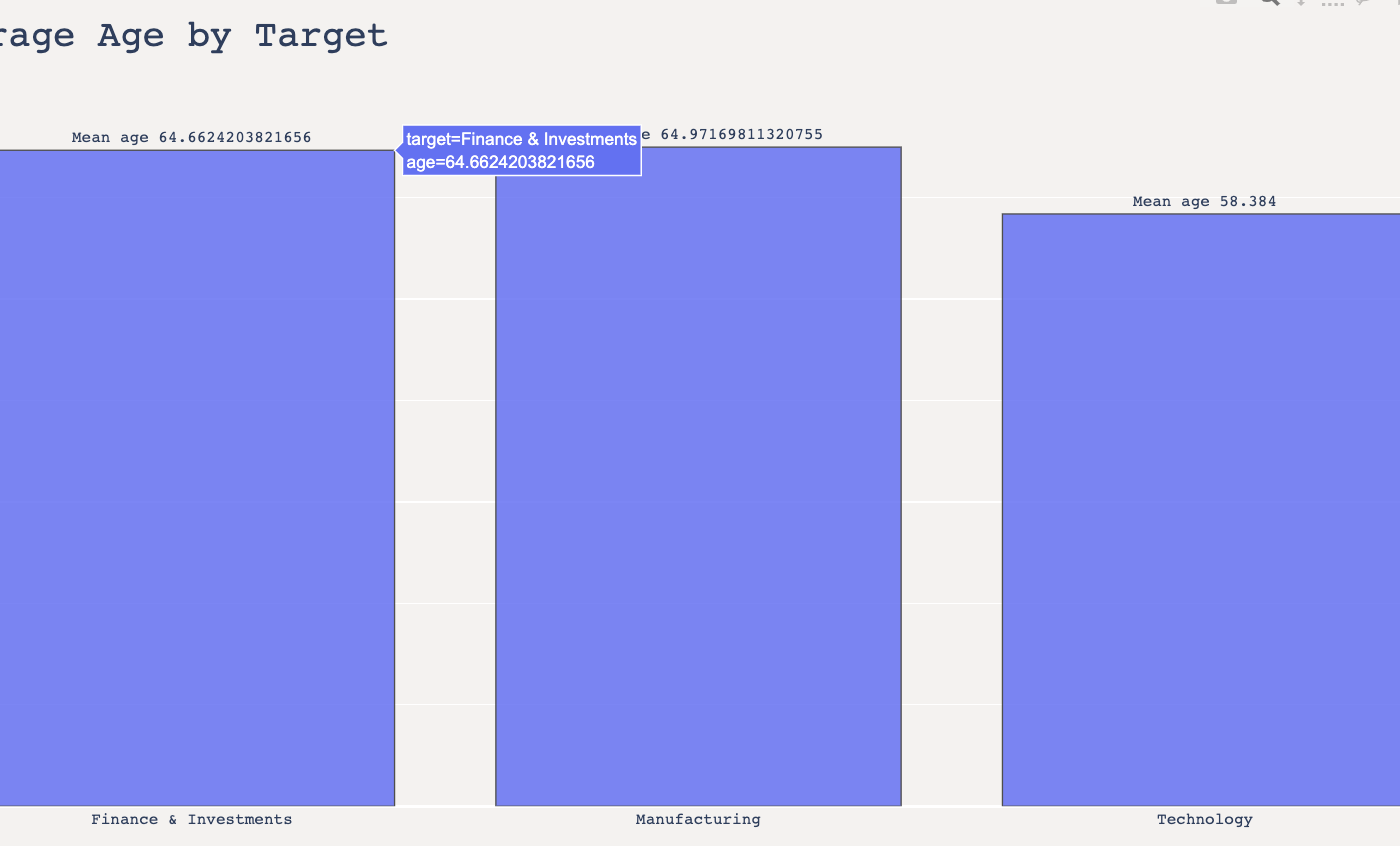
我有个情节:
下面是情节代码:
plot_df = pd.DataFrame(df.groupby('target')['age'].mean())
plot_df = plot_df.reset_index()

fig = px.bar(plot_df, x='target', y='age',height=800,
             title='Average Age by Target',
             color_discrete_map={'Finance & Investments': '#BFC5DA','Manufacturing': '#5D6A92'},
             text='age', opacity=0.85)
fig.update_traces(texttemplate='Mean age %{text:,0.f}',
                  textposition='outside',
                  marker_line=dict(width=1, color='#303030'))
fig.update_xaxes(title="Industry")
fig.update_yaxes(title="Mean Age")

fig.update_layout(paper_bgcolor='#F4F2F0',
                  plot_bgcolor='#F4F2F0',
                  title_font_size=28, font_family="monospace",
                  width=1300,
                  height=700,
                  showlegend=False)

fig.show(renderer='colab')
我已经试过很多次了,但是颜色仍然没有改变,也没有改变。
回答 1
Stack Overflow用户
发布于 2022-04-13 17:48:06
在使用color="target" Plotly创建图形时,您错过了
全工作代码
import pandas as pd
import numpy as np
import plotly.express as px

df = pd.DataFrame(
    {
        "target": np.random.choice(
            ["Finance & Investments", "Manufacturing", "Technology"], 100
        ),
        "age": np.random.uniform(15, 55),
    }
)

plot_df = pd.DataFrame(df.groupby("target")["age"].mean())
plot_df = plot_df.reset_index()

fig = px.bar(
    plot_df,
    x="target",
    y="age",
    height=800,
    title="Average Age by Target",
    color="target",  # this parameter was missed !!!
    color_discrete_map={"Finance & Investments": "#BFC5DA", "Manufacturing": "#5D6A92"},
    text="age",
    opacity=0.85,
)
fig.update_traces(
    texttemplate="Mean age %{text:,0.f}",
    textposition="outside",
    marker_line=dict(width=1, color="#303030"),
)
fig.update_xaxes(title="Industry")
fig.update_yaxes(title="Mean Age")

fig.update_layout(
    paper_bgcolor="#F4F2F0",
    plot_bgcolor="#F4F2F0",
    title_font_size=28,
    font_family="monospace",
    width=1300,
    height=700,
    showlegend=False,
)页面原文内容由Stack Overflow提供。腾讯云小微IT领域专用引擎提供翻译支持
原文链接:
https://stackoverflow.com/questions/71859677
复制相关文章
相似问题
腾讯云开发者

Copyright © 2013 - 2026 Tencent Cloud. All Rights Reserved. 腾讯云 版权所有
深圳市腾讯计算机系统有限公司 ICP备案/许可证号:粤B2-20090059 ![]() 粤公网安备44030502008569号
粤公网安备44030502008569号
腾讯云计算(北京)有限责任公司 京ICP证150476号 | 京ICP备11018762号