
如何使R用rstatix读取函数变量
如何使R用rstatix读取函数变量
提问于 2022-04-12 19:09:12
我试图在一个大数据帧上执行多个独立的t测试。当我创建要循环运行测试的函数时,rstatix将不会将函数变量作为变量并输入它们的值。
示例数据
if(!require(rstatix)){install.packages("rstatix");library('rstatix')}

set.seed(1)
df <- data.frame(
Type = sprintf("Type_%s", rep.int(1:2, times = 10)),
Read = rnorm(20))
T检验
stat.test <- df %>%
  t_test(Read ~ Type, paired = FALSE)
stat.test
没有统计数据的阴谋
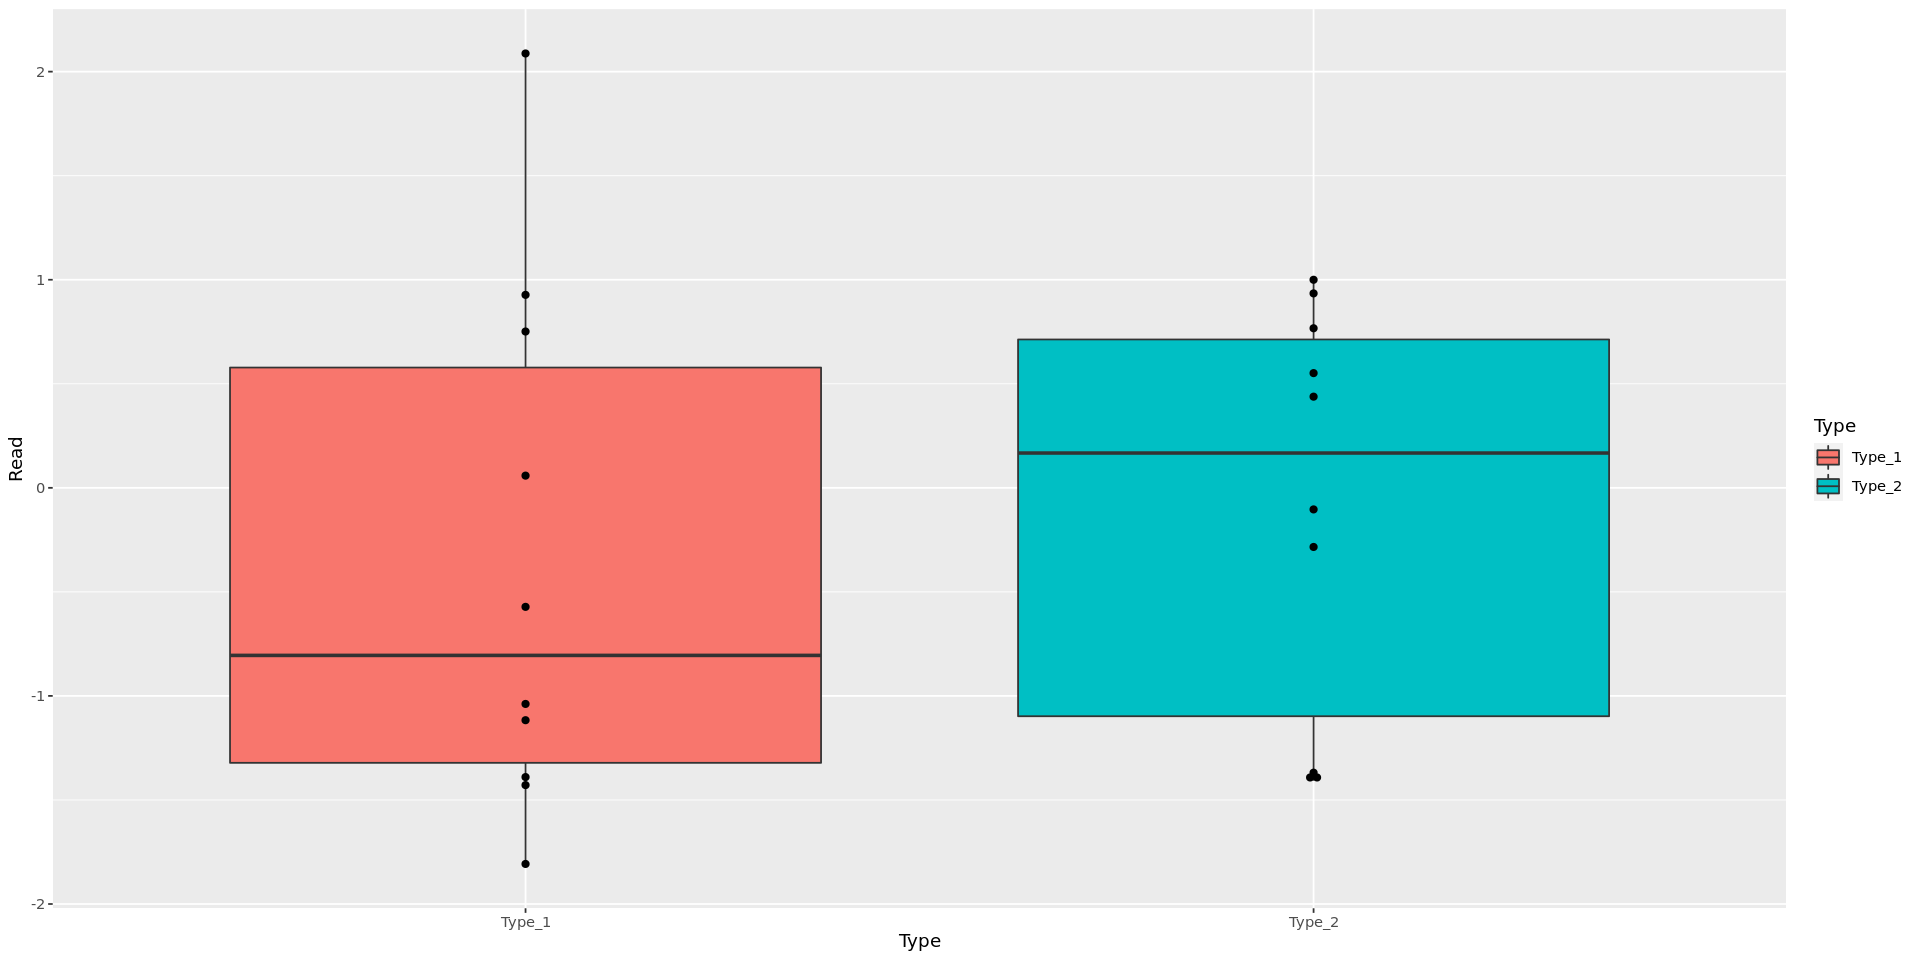
ggplot(df, aes(x = Type, y = Read))  +
      geom_boxplot(aes(fill= Type)) +
      geom_dotplot(binaxis='y', stackdir='center', dotsize=1, binwidth = 1/30)

示例函数(工作正常!)
my.function <-
function(df, var1, var2) {

    ggplot(df, aes_string(x = var1, y = var2))  +
      geom_boxplot(aes_string(fill= var1)) +
      geom_dotplot(binaxis='y', stackdir='center', dotsize=1, binwidth = 1/30)
}
my.function(df, 'Type', 'Read')
我的问题
my.function <-
function(df, var1, var2) {
    stat.test <- df %>%
      t_test(var2 ~ var1, paired = FALSE)

    ggplot(df, aes_string(x = var1, y = var2))  +
      geom_boxplot(aes_string(fill= var1)) +
      geom_dotplot(binaxis='y', stackdir='center', dotsize=1, binwidth = 1/30) +
      stat_pvalue_manual(stat.test, label = "p", y.position = 2.1)
}
my.function(df, 'Type', 'Read')上面的内容返回一个错误,因为rstatix认为var1和var2是示例数据框架中的列。
我试图让R停止这种行为,但两次尝试都失败了。
尝试1
my.function <-
function(df, var1, var2) {
    stat.test <- df %>%
      t_test(eval(parse(var2)) ~ eval(parse(var1)), paired = FALSE)

    ggplot(df, aes_string(x = var1, y = var2))  +
      geom_boxplot(aes_string(fill= var1)) +
      geom_dotplot(binaxis='y', stackdir='center', dotsize=1, binwidth = 1/30) +
      stat_pvalue_manual(stat.test, label = "p", y.position = 2.1)
}
my.function(df, 'Type', 'Read')
企图2
my.function <-
function(df, var1, var2) {
    stat.test <- df %>%
      t_test(eval(as.name(paste(var2))) ~ eval(as.name(paste(var1))), paired = FALSE)

    ggplot(df, aes_string(x = var1, y = var2))  +
      geom_boxplot(aes_string(fill= var1)) +
      geom_dotplot(binaxis='y', stackdir='center', dotsize=1, binwidth = 1/30) +
      stat_pvalue_manual(stat.test, label = "p", y.position = 2.1)
}
my.function(df, 'Type', 'Read')回答 1
Stack Overflow用户
回答已采纳
发布于 2022-04-12 20:05:13
我进入t_test函数,看看是否会有任何指示,说明为什么我试图让这个自定义函数运行会失败。我怀疑这个问题与R处理公式和函数的方式有关。在对我的原始脚本进行了一些操作之后,我终于开始工作了。
my.function <-
function(df, var1, var2) {
    stat.test <- df %>%
      t_test(as.formula(paste(var2, '~', var1)), paired = FALSE)

    ggplot(df, aes_string(x = var1, y = var2))  +
      geom_boxplot(aes_string(fill= var1)) +
      geom_dotplot(binaxis='y', stackdir='center', dotsize=1, binwidth = 1/30) +
      stat_pvalue_manual(stat.test, label = "p", y.position = 2.1)
}
my.function(df, 'Type', 'Read')

页面原文内容由Stack Overflow提供。腾讯云小微IT领域专用引擎提供翻译支持
原文链接:
https://stackoverflow.com/questions/71847935
复制相关文章
相似问题
腾讯云开发者

Copyright © 2013 - 2026 Tencent Cloud. All Rights Reserved. 腾讯云 版权所有
深圳市腾讯计算机系统有限公司 ICP备案/许可证号:粤B2-20090059 ![]() 粤公网安备44030502008569号
粤公网安备44030502008569号
腾讯云计算(北京)有限责任公司 京ICP证150476号 | 京ICP备11018762号