
熊猫只使用数值绘制双轴图
熊猫只使用数值绘制双轴图
提问于 2022-04-07 15:00:07
我有这样的数据,
import pandas as pd
from matplotlib import pyplot as plt

data = {
    "TIMEFRAME": ["9/12/2014 17:52", "10/12/2014 5:02", "10/12/2014  8:04"],
    "Volumetric Flow Meter 1": [0.82, 0.88, 0.9],
    "Pump Speed (RPM)": [2.5, 2.7, 3.01],
    "Data Source": ["raw data", "raw data", "raw data"],
    "PUMP FAILURE (1 or 0)": [0, 0, 1],
}
df = pd.DataFrame(data)df
TIMEFRAME Volumetric Flow Meter 1 Pump Speed (RPM) Data Source PUMP FAILURE (1 or 0)
9/12/2014 17:52 0.82 2.5 raw data 0
10/12/2014 5:02 0.88 2.7 raw data 0
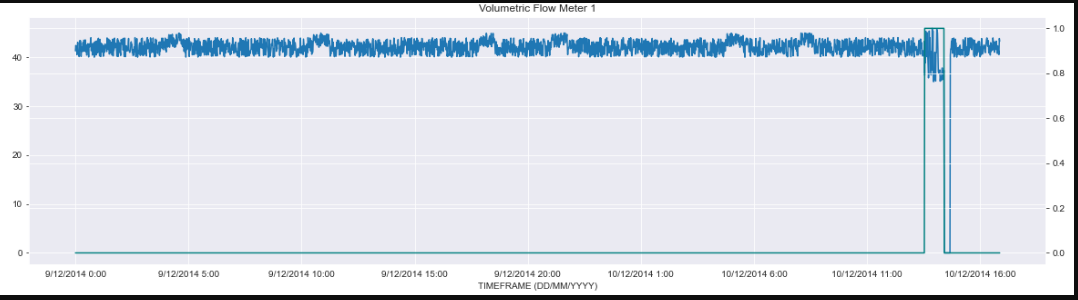
10/12/2014 8:04 0.90 3.01 raw data 1我试图循环遍历数据集,分别绘制每个数值变量,以防止泵故障来识别趋势。我必须在dataframe中创建一个每个数值列的列表,并循环它来绘制它们以防止泵故障(1或0)列。
对于每一幅图,我必须确保设置了一个双轴,以便在第二个Y轴上看到泵故障(0或1),在第一个Y轴上看到属性。
输出是这样的,
给定的代码,
ListOfVariables=[df["Pump Speed (RPM)"],df["Volumetric Flow Meter 1"]]

for item in ListOfVariables:
    first_axis = df[''].plot #Looping through every item in the dataframe
    second_axis = first_axis.twinx() #The Twinx function is used to ensure we share the X-Axis for both plots
    second_axis.plot(df['PUMP FAILURE (1 or 0)'], color='teal')
    plt.title(item)
plt.show()我对这个部分很困惑,first_axis = df[''].plot不知道该用什么。
回答 1
Stack Overflow用户
发布于 2022-04-10 07:05:58
取代:
ListOfVariables=[df["Pump Speed (RPM)"],df["Volumetric Flow Meter 1"]]与ListOfVariables=["Pump Speed (RPM)","Volumetric Flow Meter 1"]first_axis = df[''].plot与first_axis = df[item].plot()
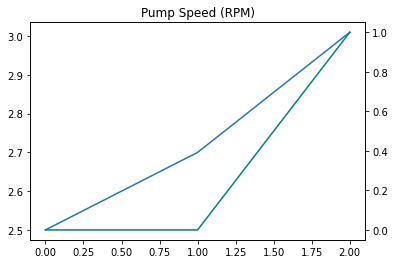
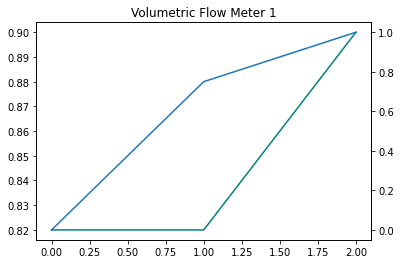
你的代码起作用了:
页面原文内容由Stack Overflow提供。腾讯云小微IT领域专用引擎提供翻译支持
原文链接:
https://stackoverflow.com/questions/71784496
复制相关文章
相似问题
腾讯云开发者

Copyright © 2013 - 2026 Tencent Cloud. All Rights Reserved. 腾讯云 版权所有
深圳市腾讯计算机系统有限公司 ICP备案/许可证号:粤B2-20090059 ![]() 粤公网安备44030502008569号
粤公网安备44030502008569号
腾讯云计算(北京)有限责任公司 京ICP证150476号 | 京ICP备11018762号