
将等量曲线添加到g图中的散点图中
将等量曲线添加到g图中的散点图中
提问于 2022-04-06 19:01:40
我很好奇,是否有人知道如何创建一个带有isoquant曲线的热图,该曲线识别所有的x和y组合,其乘积等于某个常数。最后的产品应该如下所示:
下面是生成我的绘图所用的代码,但是现在我无法像上面的图片所描述的那样在图中得到曲线:
vs.vpd.by.drop_days <- ggplot(event_drops, aes(vs, vpd)) +
  geom_point(aes(color = day_since), size = 2, alpha = 0.2) +
  scale_color_gradientn(colors = c("darkblue","green","yellow","red"),
                        breaks = c(0,25,50,75),
                        limits = c(0,75),
                        name = "Days since \n first drop") +
  ggtitle("Drops by VPD and Wind Speed") +
  theme(plot.title = element_text(size = 18, face = "bold", hjust = 0.5),
        axis.title = element_text(size = 15)) +
  xlab(label = "Wind Speed (mph)") +
  ylab(label = "Vapor Pressure Deficit") +
  expand_limits(x = 0, y = 0) +
  scale_x_continuous(expand = c(0, 0), limits = c(0,20)) +
  scale_y_continuous(expand = c(0, 0), limits = c(0,5))

vs.vpd.by.drop_days回答 1
Stack Overflow用户
回答已采纳
发布于 2022-04-06 19:08:12
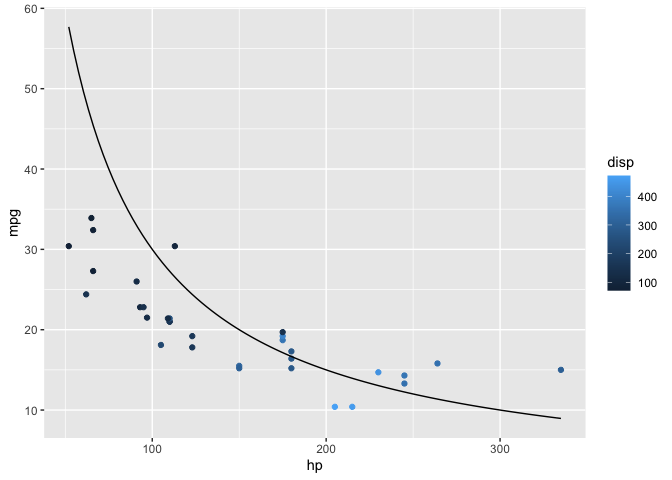
实现这一目标的一个选择是geom_function。
使用mtcars作为示例数据:
library(ggplot2)

ggplot(mtcars, aes(hp, mpg, color = disp)) +
  geom_point() +
  geom_function(fun = function(x) 3000 / x)
页面原文内容由Stack Overflow提供。腾讯云小微IT领域专用引擎提供翻译支持
原文链接:
https://stackoverflow.com/questions/71772300
复制相关文章
相似问题
腾讯云开发者

Copyright © 2013 - 2026 Tencent Cloud. All Rights Reserved. 腾讯云 版权所有
深圳市腾讯计算机系统有限公司 ICP备案/许可证号:粤B2-20090059 ![]() 粤公网安备44030502008569号
粤公网安备44030502008569号
腾讯云计算(北京)有限责任公司 京ICP证150476号 | 京ICP备11018762号