
如何用geom_smooth绘制成组的趋势线来保持斜率不变?
如何用geom_smooth绘制成组的趋势线来保持斜率不变?
提问于 2022-04-06 17:32:54
我在ggplot2中找不到一个常见的、琐碎的统计问题的明显解决方案。我希望geom_smooth(method = "lm")在color美学中保持组间的斜率常数。
我开始使用的天真模型是lm(Sepal.Width ~ Sepal.Length, data = iris)。在ggplot2中绘制此图
library(ggplot2)
ggplot(iris, aes(x = Sepal.Length, y = Sepal.Width) +
    geom_point() +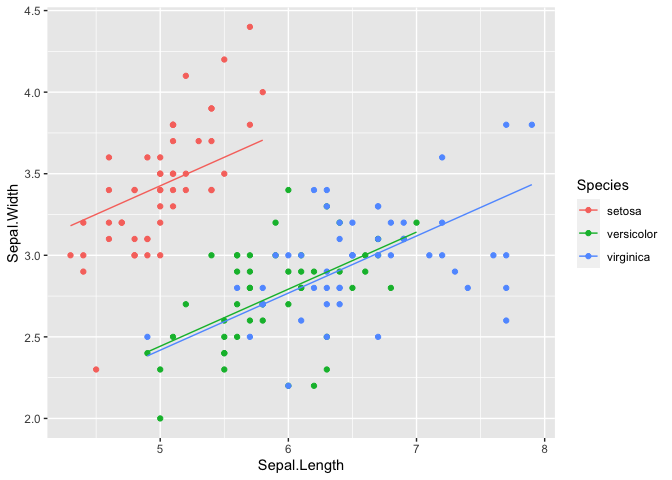
geom_smooth(method = "lm")为了为Species添加一个控件,我想测试lm(Sepal.Width ~ Sepal.Length + factor(Species), data = iris,它保持不同物种之间的斜率常数(模型用一个萼片长度系数拟合,只有不同物种之间的常数变化)。我还想测试lm(Sepal.Width ~ Sepal.Length*Species, data = iris),它允许萼片长度和萼片宽度之间的关联在不同物种之间发生变化。
第二个模型是简单易懂的:
library(ggplot2)
ggplot(iris, aes(x = Sepal.Length, y = Sepal.Width, color = Species) +
    geom_point() +
geom_smooth(method = "lm")这个地块允许斜坡发生变化。有办法防止斜坡变化吗?
回答 1
Stack Overflow用户
发布于 2022-04-06 17:47:01
您想要的结果需要一些手工工作,即估计ggplot之外的模型,并向数据中添加一个列,其中包含预测值,然后可以使用geom_line绘制该列。您要测试的其他型号也是如此:
library(ggplot2)

iris2 <- iris
iris2$fit <- predict(lm(Sepal.Width ~ Sepal.Length + factor(Species), data = iris2))

ggplot(iris2, aes(x = Sepal.Length, y = Sepal.Width, color = Species)) +
  geom_point() +
  geom_line(aes(y = fit))
页面原文内容由Stack Overflow提供。腾讯云小微IT领域专用引擎提供翻译支持
原文链接:
https://stackoverflow.com/questions/71771287
复制相关文章
相似问题
腾讯云开发者

Copyright © 2013 - 2026 Tencent Cloud. All Rights Reserved. 腾讯云 版权所有
深圳市腾讯计算机系统有限公司 ICP备案/许可证号:粤B2-20090059 ![]() 粤公网安备44030502008569号
粤公网安备44030502008569号
腾讯云计算(北京)有限责任公司 京ICP证150476号 | 京ICP备11018762号