
如何在倾斜图中标记中心节点?
如何在倾斜图中标记中心节点?
提问于 2022-03-28 09:05:19
从另一个问题中使用这个可复制的例子。如何标记/着色本地邻域图所基于的中心节点。(在本例中为“x”)
library(tidygraph)
library(ggraph)
# Example
net <- tibble::tibble(A = letters[1:6],
B = rep(c("x", "y"), each = 3)) %>%
tidygraph::as_tbl_graph()
net %>%
tidygraph::convert(to_local_neighborhood,
node = which(.N()$name == "x"),
order = 1,
mode = "all") %>%
ggraph(layout = "nicely") +
geom_edge_link() +
geom_node_point(size = 10, fill = "white", shape = 21) +
geom_node_text(aes(label = name)) +
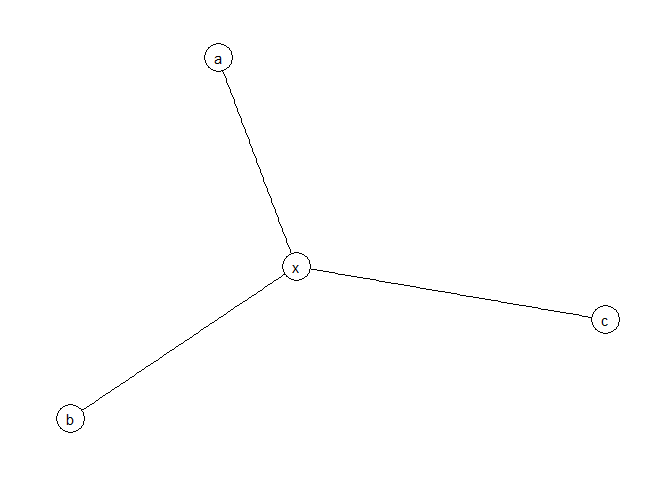
theme_graph()我得到的是:
我想要的:
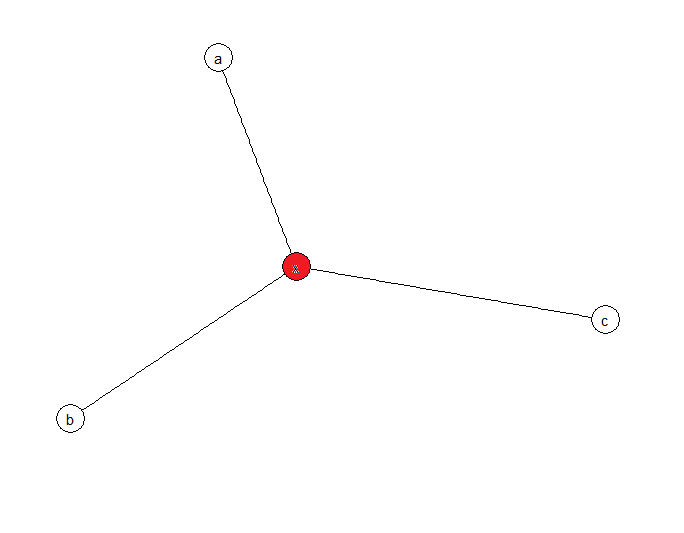
我觉得geom_node_point应该有条件填充,但我不知道这是否可能.
回答 1
Stack Overflow用户
回答已采纳
发布于 2022-03-28 09:43:07
你可以:
net %>%
  tidygraph::convert(to_local_neighborhood,
                     node = which(.N()$name == 'x'),
                     order = 1,
                     mode = "all") %>%
  mutate(root = ifelse(node_is_center(), 'red', 'white')) %>%
  ggraph(layout = "nicely") +
  geom_edge_link() +
  geom_node_point(size = 10, aes(fill = root), shape = 21) +
  geom_node_text(aes(label = name)) +
  scale_fill_identity() +
  theme_graph()
页面原文内容由Stack Overflow提供。腾讯云小微IT领域专用引擎提供翻译支持
原文链接:
https://stackoverflow.com/questions/71644885
复制相关文章
相似问题
腾讯云开发者

Copyright © 2013 - 2026 Tencent Cloud. All Rights Reserved. 腾讯云 版权所有
深圳市腾讯计算机系统有限公司 ICP备案/许可证号:粤B2-20090059 ![]() 粤公网安备44030502008569号
粤公网安备44030502008569号
腾讯云计算(北京)有限责任公司 京ICP证150476号 | 京ICP备11018762号