
用lmfit拟合两条voigt曲线,一条接一条
我在拉曼上收集了以下霓虹灯的发射光谱(背景减去数据):
    x=np.array([[1114.120887, 1114.682293, 1115.243641, 1115.80493 , 1116.366161, 1116.927334, 1117.488449, 1118.049505, 1118.610503, 1119.171443, 1119.732324, 1120.293147, 1120.853912, 1121.414619, 1121.975267, 1122.535857, 1123.096389, 1123.656863, 1124.217278, 1124.777635, 1125.337934, 1125.898175, 1126.458357, 1127.018482, 1127.578548, 1128.138556, 1128.698505, 1129.258397, 1129.81823 , 1130.378005, 1130.937722, 1131.497381, 1132.056981]])

    y=np.array([[-4.89046878e+00, -4.90985832e+00, -5.92924587e+00, -3.28194437e+00, -1.96801488e+00, -3.32070938e+00, -5.34008887e+00, -3.59466330e-01, -2.04552879e+00, -1.06490224e+00,  8.24910035e+00,  5.32297309e+01, 1.11543677e+02,  8.98576241e+01,  2.18504948e+02,  7.15152212e+02, 7.62799601e+02,  2.89446870e+02,  7.24275144e+01,  1.94081610e+01, 1.72212272e+00,  7.02773412e-01, -3.16573861e-01,  4.99745483e+00, 7.97811157e+00,  6.25396305e-01,  6.27274408e+00, -4.41328018e+00, -7.76592840e+00,  3.88142539e+00,  6.52872017e+00,  1.50939096e+00, -8.43249208e-01]])
我使用lmfit安装了一个Voigt函数,具体如下:
    model = VoigtModel()+ ConstantModel()
    params=model.make_params(center=1123.096389, amplitude=1000, sigma=0.27)
    result = model.fit(y.flatten(), params, x=x.flatten())
LH肩部有第二个峰值(抱歉不能张贴图像)-人们使用商业峰值拟合软件适合第一个voigt,然后添加第二个,然后它调整两者的配合。我怎么才能在蟒蛇身上做到这一点?
一个相关的问题--是否有一种方法来优化在峰值拟合中包含多少点。现在,我只是给x和y的数据覆盖一个设定的光谱范围来做峰值拟合。但是,商业软件优化了在给定的峰值拟合中包含多少范围(我假设使用剩余值)。我怎么才能重现这一切?
谢谢!
回答 1
Stack Overflow用户
发布于 2022-04-20 10:07:04
您可以手动这样做:
import numpy as np
import matplotlib.pyplot as plt
from lmfit.models import VoigtModel, ConstantModel

x=np.array([1114.120887, 1114.682293, 1115.243641, 1115.80493 , 1116.366161, 1116.927334, 1117.488449, 1118.049505, 1118.610503, 1119.171443, 1119.732324, 1120.293147, 1120.853912, 1121.414619, 1121.975267, 1122.535857, 1123.096389, 1123.656863, 1124.217278, 1124.777635, 1125.337934, 1125.898175, 1126.458357, 1127.018482, 1127.578548, 1128.138556, 1128.698505, 1129.258397, 1129.81823 , 1130.378005, 1130.937722, 1131.497381, 1132.056981])
y=np.array([-4.89046878e+00, -4.90985832e+00, -5.92924587e+00, -3.28194437e+00, -1.96801488e+00, -3.32070938e+00, -5.34008887e+00, -3.59466330e-01, -2.04552879e+00, -1.06490224e+00,  8.24910035e+00,  5.32297309e+01, 1.11543677e+02,  8.98576241e+01,  2.18504948e+02,  7.15152212e+02, 7.62799601e+02,  2.89446870e+02,  7.24275144e+01,  1.94081610e+01, 1.72212272e+00,  7.02773412e-01, -3.16573861e-01,  4.99745483e+00, 7.97811157e+00,  6.25396305e-01,  6.27274408e+00, -4.41328018e+00, -7.76592840e+00,  3.88142539e+00,  6.52872017e+00,  1.50939096e+00, -8.43249208e-01])

model = VoigtModel() + ConstantModel()
params=model.make_params(center=1123.0, amplitude=1000, sigma=0.27)
result1 = model.fit(y.flatten(), params, x=x.flatten())

rest = y-result1.best_fit

model = VoigtModel() + ConstantModel()
params=model.make_params(center=1120.5, amplitude=200, sigma=0.27)
result2 = model.fit(rest, params, x=x.flatten())

rest -= result2.best_fit

plt.plot(x, y, label='Original')
plt.plot(x, result1.best_fit, label='1123.0')
plt.plot(x, result2.best_fit, label='1120.5')
plt.plot(x, rest, label='residual')
plt.legend()
plt.show()
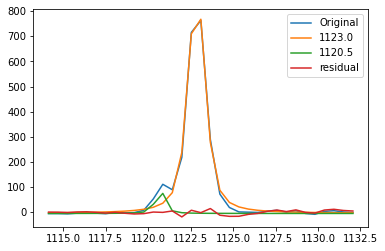
你必须确保残余物是有意义的。在这种情况下,非常接近于0,所以我认为它是好的。
lmfit确实优化了拟合,因此不需要精确地确定峰值位置的值。此外,必须指出,由于这些数据的分辨率(以及一般的光谱学),最高点不一定是峰值的中心。此外,由于同样的原因,一些肩膀可能不是肩膀,虽然在这种情况下,它看起来是。
对于您的相关问题--根据文档 of lmfit的判断,它使用您输入的所有范围。残差似乎不是一个解决方案,因为您陷入相同的问题(需要考虑的范围)。我相信你提到的商业软件使用多元曲线解析(MCR)。这些反褶积问题几十年来一直是一个热门话题。如果您对这种解决方案感兴趣,我建议阅读有关多元曲线分辨率(MCR)。
https://stackoverflow.com/questions/71632289
复制相似问题
腾讯云开发者

Copyright © 2013 - 2026 Tencent Cloud. All Rights Reserved. 腾讯云 版权所有
深圳市腾讯计算机系统有限公司 ICP备案/许可证号:粤B2-20090059 ![]() 粤公网安备44030502008569号
粤公网安备44030502008569号
腾讯云计算(北京)有限责任公司 京ICP证150476号 | 京ICP备11018762号