
ggplot2基于另一个变量而不是填充变量创建图例
ggplot2基于另一个变量而不是填充变量创建图例
提问于 2022-03-25 02:50:27
下面的代码是:
test <- data.frame(method = c("A1", "A1", "A1", "A1", "A1", "A2",
"A2", "A2", "A2", "A2", "A3", "A3", "A3", "A3", "A3", "A4", "A4",
"A4", "A4", "A4", "A5", "A5", "A5", "A5", "A5", "A6", "A6", "A6",
"A6", "A6", "A7", "A7", "A7", "A7", "A7", "A8", "A8", "A8", "A8",
"A8", "A9", "A9", "A9", "A9", "A9", "A10", "A10", "A10", "A10",
"A10", "A11", "A11", "A11", "A11", "A11"),
variable = rep(c("cp_ic5","cp_ic50","cp_ic95","cp_b0","cp_b1"),11),
avg_cp = c(0.55, 0.54, 0.561, 0.544, 0.557, 0.036,
0.382, 0.412, 0.387, 0.42, 0.778, 0.866, 0.824, 0.863, 0.757,
0.127, 0.541, 0.560, 0.542, 0.555, 0.757, 0.697, 0.778,
0.661, 0.735, 0.704, 0.641, 0.726, 0.662, 0.735, 0.605, 0.574, 0.616, 0.586,
0.642, 0.597, 0.55, 0.617, 0.564, 0.624, 0.572, 0.525, 0.589,
0.538, 0.598, 0, 0, 0, 0.524, 0.593, 0, 0, 0, 0.752, 0.76))
library(ggpattern)
library(ggplot2)
mycolors = c("#D95F02", "#1B9E77", "#E31A1C", "#66A61E", "#E7298A", "#E6AB02",
"#A6761D", "#666666", "#A6CEE3", "#1F78B4", "#B2DF8A", "#33A02C", "#FB9A99", "#7570B3")
p_cp <- ggplot(test, aes(method, avg_cp, fill=method)) +
scale_y_continuous(limits=c(0,1),labels = scales::percent)+
geom_col_pattern(position = position_dodge2(preserve = 'single'),
color="black",
# position = "dodge",
pattern = c(rep(c("circle", "stripe", "stripe", "stripe", "crosshatch"),11)),
pattern_angle = c(rep(c(45, 45,135, 0, 45), 11)),
pattern_density = .05,
pattern_spacing = .02,
pattern_fill = 'black'
) +
# scale_colour_manual(values = c('Individual Runs'=mycolors))+
scale_fill_manual(values = mycolors) +
# labels = c(expression( IC[5]),expression( IC[50]),
# expression(IC[95]),expression(beta[0]),expression(beta[1]))) +
guides(group = guide_legend("Estimands",
override.aes =
list(
pattern = c("circle", "stripe", "stripe", "stripe", "crosshatch"),
pattern_spacing = .02,
pattern_angle = c(45, 45,135, 0, 45)
)
)) +
theme_bw() +ylab("Average Coverage Probability") + labs(tag="A") +
theme(legend.position="top",
axis.text.x = element_text(angle = 45, hjust = 1, size=xfont),
axis.title.x = element_blank(),
panel.border = element_blank(),
panel.grid.major.x = element_blank(),
panel.grid.minor.x = element_blank()
);
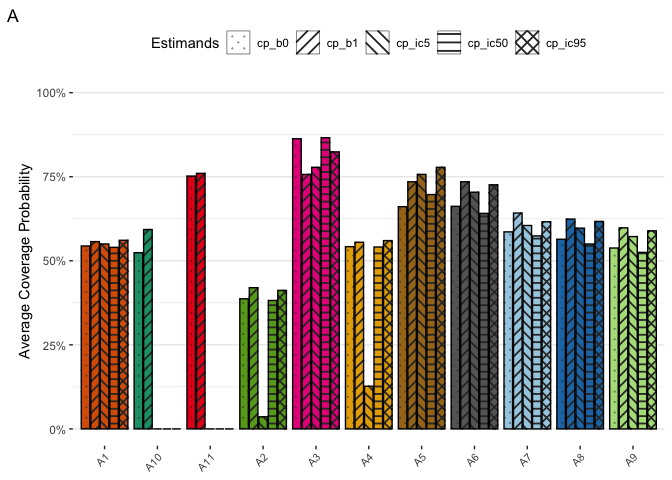
p_cp输出是
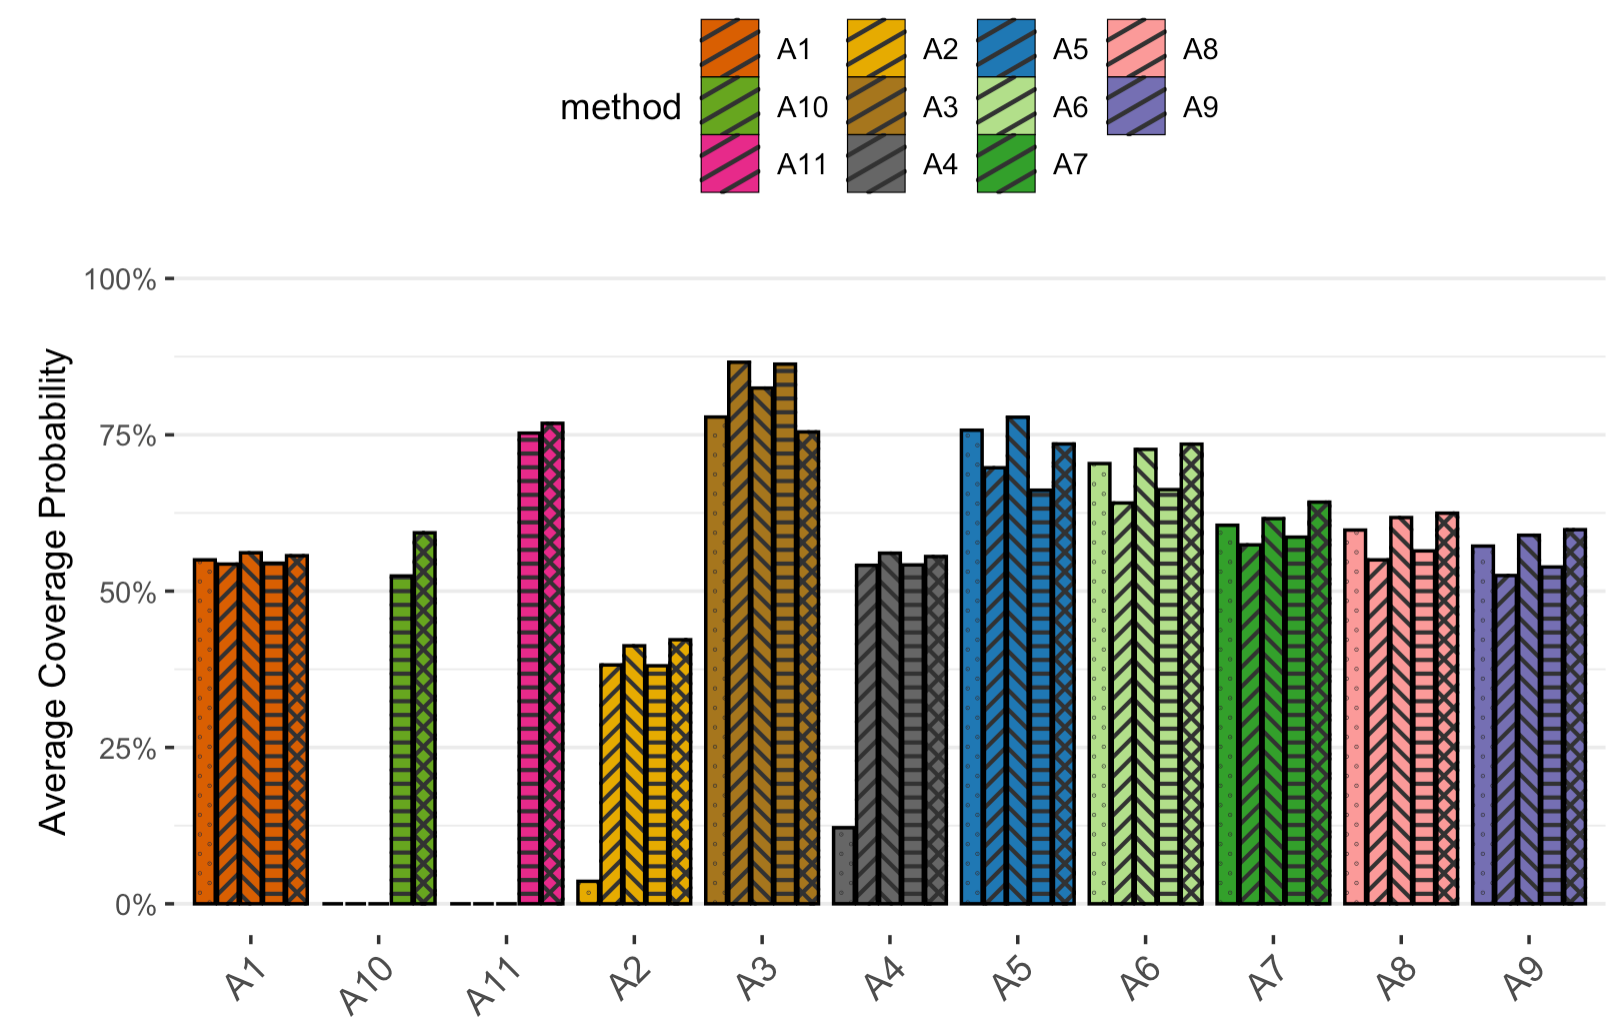
然而,我想根据group=variable而不是fill=method来改变这个传说。预期的产出应是:
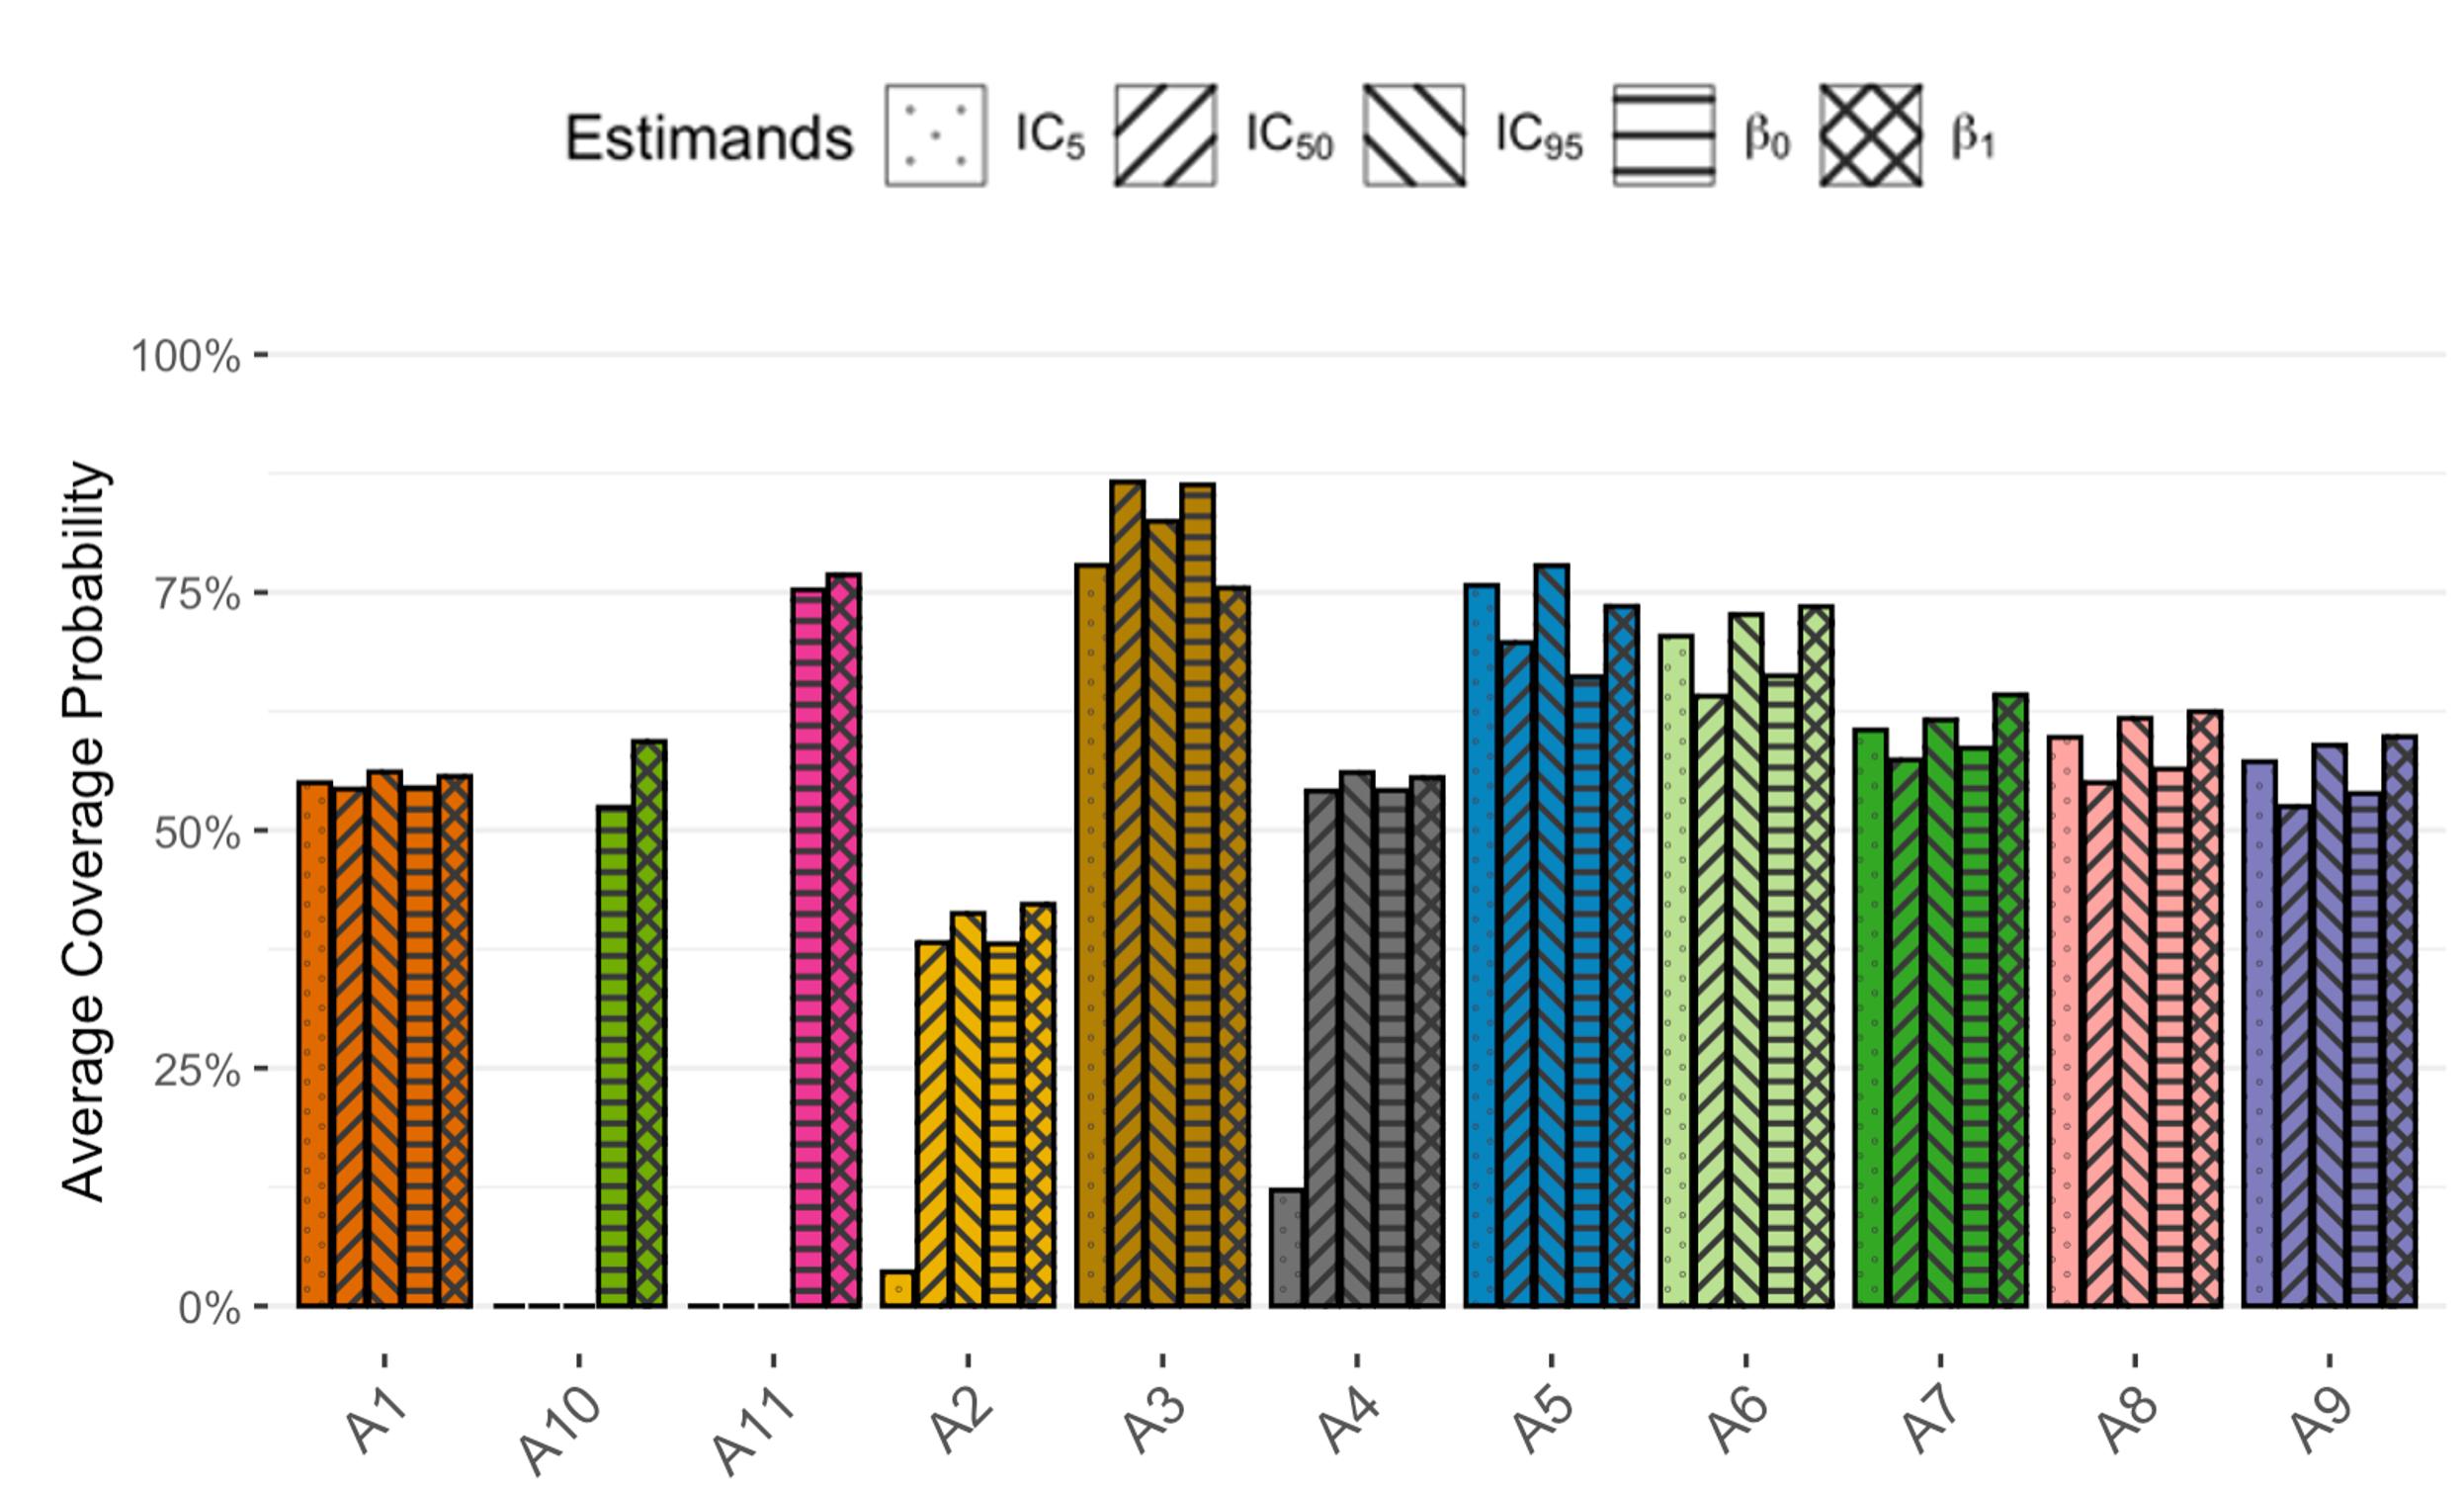
我应该如何修改我的代码以实现这个结果?
回答 1
Stack Overflow用户
回答已采纳
发布于 2022-03-25 06:29:18
一种选择是将您的组列映射到alpha aes上,这将为您的情节添加第二个图例。然后将alpha值固定为1,删除填充图例并覆盖alpha图例的填充颜色:
library(ggpattern)
library(ggplot2)

mycolors <- c(
  "#D95F02", "#1B9E77", "#E31A1C", "#66A61E", "#E7298A", "#E6AB02",
  "#A6761D", "#666666", "#A6CEE3", "#1F78B4", "#B2DF8A", "#33A02C", "#FB9A99", "#7570B3"
)

xfont <- 8
p_cp <- ggplot(test, aes(method, avg_cp, alpha = variable, fill = method)) +
  scale_y_continuous(limits = c(0, 1), labels = scales::percent) +
  geom_col_pattern(
    position = position_dodge2(preserve = "single"),
    color = "black",
    pattern = c(rep(c("circle", "stripe", "stripe", "stripe", "crosshatch"), 11)),
    pattern_angle = c(rep(c(45, 45, 135, 0, 45), 11)),
    pattern_density = .05,
    pattern_spacing = .02,
    pattern_fill = "black"
  ) +
  scale_fill_manual(values = mycolors) +
  scale_alpha_manual(values = rep(1, length(unique(test$variable)))) +
  guides(fill = "none",
         alpha = guide_legend("Estimands",
    override.aes =
      list(
        pattern = c("circle", "stripe", "stripe", "stripe", "crosshatch"),
        pattern_spacing = .02,
        pattern_angle = c(45, 45, 135, 0, 45),
        fill = NA
      )
  )) +
  theme_bw() +
  ylab("Average Coverage Probability") +
  labs(tag = "A") +
  theme(
    legend.position = "top",
    axis.text.x = element_text(angle = 45, hjust = 1, size = xfont),
    axis.title.x = element_blank(),
    panel.border = element_blank(),
    panel.grid.major.x = element_blank(),
    panel.grid.minor.x = element_blank()
  )
p_cp
页面原文内容由Stack Overflow提供。腾讯云小微IT领域专用引擎提供翻译支持
原文链接:
https://stackoverflow.com/questions/71611627
复制相关文章
相似问题
腾讯云开发者

Copyright © 2013 - 2026 Tencent Cloud. All Rights Reserved. 腾讯云 版权所有
深圳市腾讯计算机系统有限公司 ICP备案/许可证号:粤B2-20090059 ![]() 粤公网安备44030502008569号
粤公网安备44030502008569号
腾讯云计算(北京)有限责任公司 京ICP证150476号 | 京ICP备11018762号