
用填充变量连接图
用填充变量连接图
提问于 2022-03-21 16:54:40
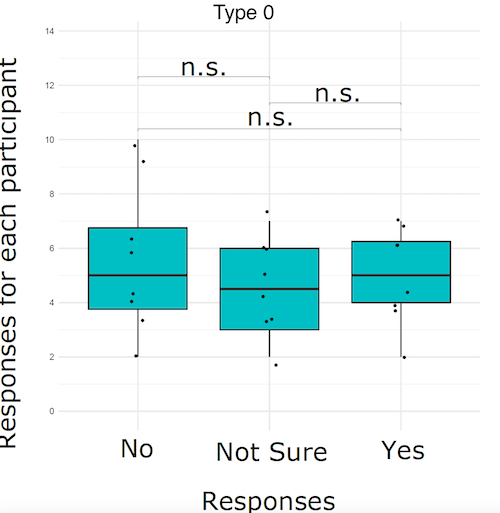
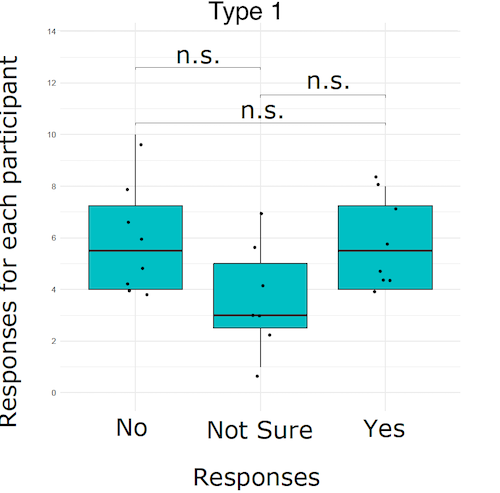
我有下面的数据,我正在绘制下面的2幅图,方法是根据type (1或0)将数据分开。我现在正试图加入他们的一个阴谋和执行t测试。1样地应包含6个方格图,依次为:No-No、NS-NS、Y-Y,各组之间应进行t检验。每一组都应该有自己的填充颜色。
这是我目前正在使用的代码。在代码中添加类型变量的位置?我试过在aes()和作为fill=type,但它没有工作
样本:
structure(list(id = c(1, 1, 1, 1, 1, 1, 1, 1, 1, 1, 1, 1, 1,
1, 1, 1, 1, 1, 1, 1, 1, 1, 1, 1, 1, 1, 1, 1, 1, 1, 2, 2, 2, 2,
2, 2, 2, 2, 2, 2, 2, 2, 2, 2, 2, 2, 2, 2, 2, 2, 2, 2, 2, 2, 2,
2, 2, 2, 2, 2, 5, 5, 5, 5, 5, 5, 5, 5, 5, 5, 5, 5, 5, 5, 5, 5,
5, 5, 5, 5), trial = c(0, 1, 2, 3, 4, 5, 6, 7, 8, 10, 11, 12,
13, 14, 15, 16, 17, 18, 20, 21, 22, 23, 24, 25, 26, 27, 31, 32,
33, 35, 0, 3, 4, 5, 7, 9, 10, 11, 12, 13, 14, 15, 16, 17, 19,
20, 21, 22, 23, 24, 25, 26, 27, 28, 30, 31, 32, 33, 34, 35, 0,
1, 2, 3, 4, 5, 6, 7, 9, 11, 12, 14, 15, 16, 17, 18, 19, 20, 21,
23), response = c(1, -1, 1, 1, 1, 1, -1, 1, 0, 1, 0, 0, 0, 0,
1, -1, 0, 1, 0, 1, 1, 0, 0, 0, 0, -1, 1, -1, 0, 0, -1, 1, 0,
1, -1, 0, -1, 1, 1, 1, 1, 1, -1, 1, 1, 1, 1, 0, -1, 1, 1, 1,
0, 0, 1, 1, 0, 1, 1, 0, 0, 0, 0, 1, 1, 1, 1, -1, 1, 0, 1, 1,
0, 1, 1, 1, 1, 0, 0, 0), default = c(0, 0, 0, 0, 0, 0, 0, 0,
0, 0, 0, 0, 0, 0, 0, 0, 0, 0, 0, 0, 0, 0, 0, 0, 0, 0, 0, 0, 0,
0, 0, 0, 0, 0, 0, 0, 0, 0, 0, 0, 0, 0, 0, 0, 0, 0, 0, 0, 0, 0,
0, 0, 0, 0, 0, 0, 0, 0, 0, 0, 0, 0, 0, 0, 0, 0, 0, 0, 0, 0, 0,
0, 0, 0, 0, 0, 0, 0, 0, 0), correct = c(1, 1, 1, 1, 1, 1, 1,
1, 1, 1, 1, 1, 1, 1, 1, 1, 1, 1, 1, 1, 1, 1, 1, 1, 1, 1, 1, 1,
1, 1, 1, 1, 1, 1, 1, 1, 1, 1, 1, 1, 1, 1, 1, 1, 1, 1, 1, 1, 1,
1, 1, 1, 1, 1, 1, 1, 1, 1, 1, 1, 1, 1, 1, 1, 1, 1, 1, 1, 1, 1,
1, 1, 1, 1, 1, 1, 1, 1, 1, 1), iscorrect = c(1, 0, 1, 1, 1, 1,
0, 1, 0, 1, 0, 0, 0, 0, 1, 0, 0, 1, 0, 1, 1, 0, 0, 0, 0, 0, 1,
0, 0, 0, 0, 1, 0, 1, 0, 0, 0, 1, 1, 1, 1, 1, 0, 1, 1, 1, 1, 0,
0, 1, 1, 1, 0, 0, 1, 1, 0, 1, 1, 0, 0, 0, 0, 1, 1, 1, 1, 0, 1,
0, 1, 1, 0, 1, 1, 1, 1, 0, 0, 0), min = c(150, 50, 150,
150, 100, 150, 150, 100, 50, 100, 150, 50, 100, 50, 100, 100,
150, 50, 50, 100, 150, 150, 50, 50, 100, 50, 150, 100, 50, 100,
100, 50, 50, 50, 100, 50, 150, 50, 150, 50, 150, 150, 150, 150,
100, 100, 100, 150, 100, 100, 150, 100, 50, 150, 50, 150, 50,
100, 100, 50, 100, 100, 50, 150, 150, 150, 150, 50, 100, 150,
100, 150, 100, 50, 100, 150, 150, 50, 50, 100), max = c(180.8,
62.4, 180.8, 180.8, 125.4, 180.8, 180.8, 125.4, 62.4, 125.4,
180.8, 62.4, 125.4, 62.4, 125.4, 125.4, 180.8, 62.4, 62.4, 125.4,
180.8, 180.8, 62.4, 62.4, 125.4, 62.4, 180.8, 125.4, 62.4, 125.4,
125.4, 62.4, 62.4, 62.4, 125.4, 62.4, 180.8, 62.4, 180.8, 62.4,
180.8, 180.8, 180.8, 180.8, 125.4, 125.4, 125.4, 180.8, 125.4,
125.4, 180.8, 125.4, 62.4, 180.8, 62.4, 180.8, 62.4, 125.4, 125.4,
62.4, 125.4, 125.4, 62.4, 180.8, 180.8, 180.8, 180.8, 62.4, 125.4,
180.8, 125.4, 180.8, 125.4, 62.4, 125.4, 180.8, 180.8, 62.4,
62.4, 125.4), time = c(3, 3, 7, 9, 7, 9, 7, 5, 1, 9, 3, 7,
3, 9, 9, 5, 5, 5, 5, 3, 1, 1, 3, 7, 1, 9, 5, 1, 1, 7, 1, 7, 1,
5, 7, 3, 7, 5, 9, 9, 3, 5, 1, 9, 9, 9, 3, 1, 7, 3, 7, 1, 7, 3,
1, 5, 9, 5, 5, 3, 5, 1, 5, 1, 5, 3, 7, 9, 7, 3, 9, 5, 5, 1, 3,
9, 1, 3, 7, 3), type = c(1, 0, 0, 0, 1, 1, 1, 1, 0, 1, 0, 0,
0, 1, 0, 0, 0, 1, 0, 1, 1, 0, 1, 1, 0, 0, 1, 1, 1, 0, 0, 0, 0,
0, 0, 0, 1, 1, 0, 1, 1, 0, 1, 1, 1, 0, 1, 0, 1, 0, 0, 1, 1, 0,
1, 1, 0, 0, 1, 1, 1, 1, 0, 0, 1, 0, 0, 1, 1, 1, 1, 0, 0, 1, 0,
1, 1, 0, 1, 1)), row.names = c(NA, -80L), class = c("tbl_df",
"tbl", "data.frame"))
这是我的代码:
df %>%
  group_by(id, response) %>%
  count() %>%
  mutate(id = factor(id), response = factor(response)) %>%
  ggplot(aes(response, n), fill=type) +
  geom_boxplot(fill = "#00BFC4", outlier.shape = NA) +
  geom_jitter(position=position_jitter(0.05), size=1) +
  labs(title= "Test multiple conditions boxplot") +
  scale_y_continuous(breaks=seq(0,14,2), limits = c(0,14), name = "Number of responses per participant") +
  scale_x_discrete(name="Possible Responses", limits=c("0","-1","1"), labels=c("-1" = "Not Sure", "1" = "Yes", "0" = "No")) +
  theme_minimal() +
  stat_compare_means(comparisons = cmpr, tip.length=0.01,
                     label = "p.signif",
                     method = "t.test",
                     symnum.args = list(cutpoints = c(0, 0.0001, 0.001, 0.01, 0.05, 1),
                                        symbols = c("****", "***", "**", "*", "ns")))
目前的情节:
回答 1
Stack Overflow用户
发布于 2022-03-22 12:19:50
不知道这是不是你的目标。我使用facet_wrap对齐绘图,并在stat_compare_means()中定义了类型
样本代码:
df$type=factor(df$type, levels=c("1","0"))

type_names <- c(
  `1` = "Type 1",
  `0` = "Type 0")


df %>%
  group_by(id, response, type) %>%
  count() %>%
  mutate(id = factor(id), response = factor(response)) %>%
  ggplot(aes(response, n), fill=type) +
  facet_wrap(~type, labeller = as_labeller(type_names))+ # define the names of the facets
  geom_boxplot(fill = "#00BFC4", outlier.shape = NA) +
  geom_jitter(position=position_jitter(0.05), size=1) +
  labs(title= "Test multiple conditions boxplot") +
  scale_y_continuous(breaks=seq(0,14,2), limits = c(0,14), name = "Number of responses per participant") +
  scale_x_discrete(name="Possible Responses", limits=c("0","-1","1"), labels=c("-1" = "Not Sure", "1" = "Yes", "0" = "No")) +
  theme_minimal() +
  stat_compare_means(comparisons = df$type,  # here you need to define the type
                     tip.length=0.01,
                     label = "p.signif",
                     method = "t.test",
                     symnum.args = list(cutpoints = c(0, 0.0001, 0.001, 0.01, 0.05, 1),
                                        symbols = c("****", "***", "**", "*", "ns")))
情节:
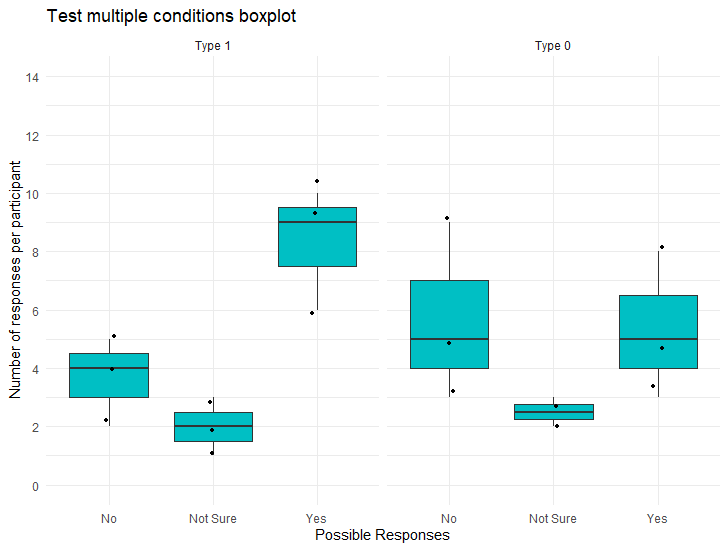
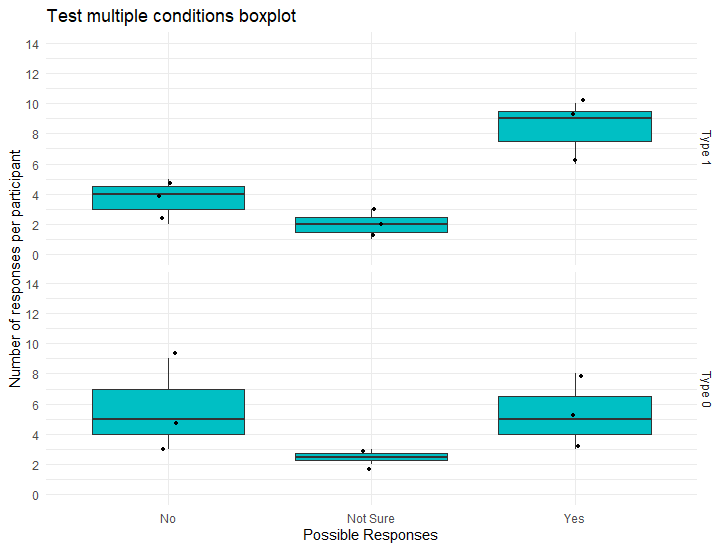
或者您可以使用facet_grid(rows = vars(type))
样本代码:
df$type[df$type %in% "1"] <- "Type 1"
df$type[df$type %in% "0"] <- "Type 0"

df$type=factor(df$type, levels=c("Type 1","Type 0"))

df %>%
  group_by(id, response, type) %>%
  count() %>%
  mutate(id = factor(id), response = factor(response)) %>%
  ggplot(aes(response, n), fill=response) +
  facet_grid(rows = vars(type))+
  geom_boxplot(fill = "#00BFC4", outlier.shape = NA) +
  geom_jitter(position=position_jitter(0.05), size=1) +
  labs(title= "Test multiple conditions boxplot") +
  scale_y_continuous(breaks=seq(0,14,2), limits = c(0,14), name = "Number of responses per participant") +
  scale_x_discrete(name="Possible Responses", limits=c("0","-1","1"), labels=c("-1" = "Not Sure", "1" = "Yes", "0" = "No")) +
  theme_minimal() +
  stat_compare_means(comparisons = df$type,
                     tip.length=0.01,
                     label = "p.signif",
                     method = "t.test",
                     symnum.args = list(cutpoints = c(0, 0.0001, 0.001, 0.01, 0.05, 1),
                                        symbols = c("****", "***", "**", "*", "ns")))
页面原文内容由Stack Overflow提供。腾讯云小微IT领域专用引擎提供翻译支持
原文链接:
https://stackoverflow.com/questions/71561265
复制相关文章
相似问题
腾讯云开发者

Copyright © 2013 - 2026 Tencent Cloud. All Rights Reserved. 腾讯云 版权所有
深圳市腾讯计算机系统有限公司 ICP备案/许可证号:粤B2-20090059 ![]() 粤公网安备44030502008569号
粤公网安备44030502008569号
腾讯云计算(北京)有限责任公司 京ICP证150476号 | 京ICP备11018762号