
如何将工作区相关性划分为n单元
如何将工作区相关性划分为n单元
提问于 2022-03-20 08:44:22
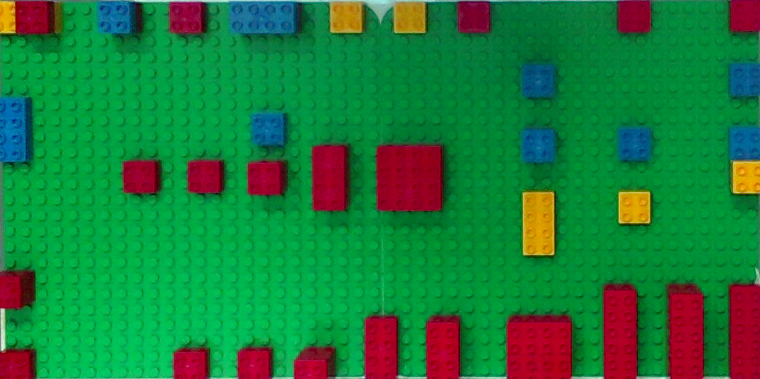
我有这个输入图像,我想把它网格到单元格22 x 10中,然后量化块的颜色。
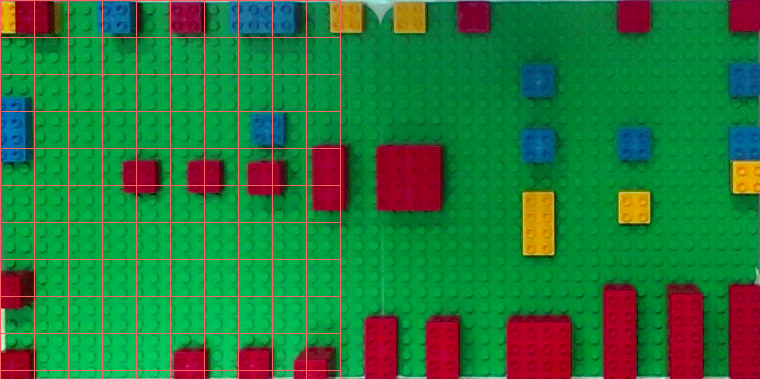
当我试图重用这个answer时,这个4 x 4工作区已经完美地工作了,我得到了错误的网格:
注意到这种动态方法是必要的,因为我可能有不同数量的单元格,分辨率等等。
你能告诉我原解决方案的修改有什么问题吗?提前谢谢。
#!/usr/bin/python3
# -*- coding: utf-8 -*-

import numpy as np
import cv2


def gridWorkspace(roi, gridSize=(10, 22), verbose=True):
    """
    Function: gridWorkspace, to find the contours of the red markers.
    ---
    Parameters:
    @param: roi, nd array, cropped region of interest.
    @param: gridSize, tuple, lenght/width or the Workspace.
    @param: verbose, boolean, to show the output of the function.
    ---
    @return: cellList, list, cells coordinates list,
            cellCenters, list, cells centers list.
    """
    # Store a deep copy for results:
    roi_copy = roi.copy()

    # Divide the image into a grid:
    verticalCells   = gridSize[1]
    horizontalCells = gridSize[0]

    # Cell dimensions
    bigRectWidth  =  roi.shape[1]
    bigRectHeight =  roi.shape[0]

    cellWidth = bigRectWidth // verticalCells
    cellHeight = bigRectHeight // horizontalCells

    # Store the cells here:
    cellList = []

    # Store cell centers here:
    cellCenters = []

    # Loop thru vertical dimension:
    for j in range(verticalCells):

        # Cell starting y position:
        yo = j * cellHeight

        # Loop thru horizontal dimension:
        for i in range(horizontalCells):

            # Cell starting x position:
            xo = i * cellWidth

            # Cell Dimensions:
            cX = int(xo)
            cY = int(yo)

            # Crop current cell:
            currentCell = roi[cY:cY + cellHeight, cX:cX + cellWidth]

            # into the cell list:
            cellList.append(currentCell)

            # Store cell center:
            cellCenters.append((cX + 0.5 * cellWidth, cY + 0.5 * cellHeight))

            # Draw Cell
            cv2.rectangle(roi_copy, (cX, cY), (cX + cellWidth, cY + cellHeight), (100, 100, 255), 1)

    # Visualize results
    if(verbose):
        cv2.namedWindow("Grid", cv2.WINDOW_NORMAL)
        cv2.imshow("Grid", roi_copy)
        cv2.waitKey(0)

    return cellList, cellCenters

roi = cv2.imread("DsUYY.png")
res = gridWorkspace(roi)回答 1
Stack Overflow用户
回答已采纳
发布于 2022-03-20 09:15:41
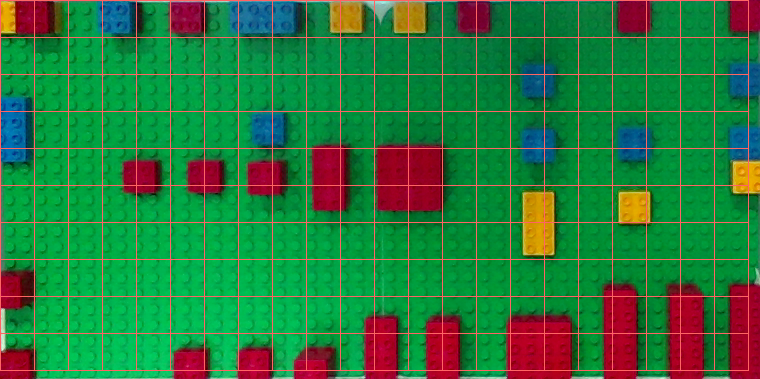
检查verticalCells,horizontalCells和gridSizeindex两次!!
#!/usr/bin/python3
# -*- coding: utf-8 -*-

import numpy as np
import cv2


def gridWorkspace(roi, gridSize=(22, 10), verbose=True):
    """
    Function: gridWorkspace, to find the contours of the red markers.
    ---
    Parameters:
    @param: roi, nd array, cropped region of interest.
    @param: gridSize, tuple, lenght/width or the Workspace.
    @param: verbose, boolean, to show the output of the function.
    ---
    @return: cellList, list, cells coordinates list,
            cellCenters, list, cells centers list.
    """
    # Store a deep copy for results:
    roi_copy = roi.copy()

    # Divide the image into a grid:
    verticalCells   = gridSize[1]
    horizontalCells = gridSize[0]

    # Cell dimensions
    bigRectWidth  =  roi.shape[1]
    bigRectHeight =  roi.shape[0]

    cellWidth = bigRectWidth // horizontalCells
    cellHeight = bigRectHeight // verticalCells

    # Store the cells here:
    cellList = []

    # Store cell centers here:
    cellCenters = []

    # Loop thru vertical dimension:
    for j in range(verticalCells):

        # Cell starting y position:
        yo = j * cellHeight

        # Loop thru horizontal dimension:
        for i in range(horizontalCells):

            # Cell starting x position:
            xo = i * cellWidth

            # Cell Dimensions:
            cX = int(xo)
            cY = int(yo)

            # Crop current cell:
            currentCell = roi[cY:cY + cellHeight, cX:cX + cellWidth]

            # into the cell list:
            cellList.append(currentCell)

            # Store cell center:
            cellCenters.append((cX + 0.5 * cellWidth, cY + 0.5 * cellHeight))

            # Draw Cell
            cv2.rectangle(roi_copy, (cX, cY), (cX + cellWidth, cY + cellHeight), (100, 100, 255), 1)

    # Visualize results
    if(verbose):
        cv2.namedWindow("Grid", cv2.WINDOW_NORMAL)
        cv2.imshow("Grid", roi_copy)
        cv2.waitKey(0)

    return cellList, cellCenters

roi = cv2.imread("/Users/buenos/buenos/playground/python/assets/DsUYY.png")
res = gridWorkspace(roi)
页面原文内容由Stack Overflow提供。腾讯云小微IT领域专用引擎提供翻译支持
原文链接:
https://stackoverflow.com/questions/71545294
复制相关文章
相似问题
腾讯云开发者

Copyright © 2013 - 2026 Tencent Cloud. All Rights Reserved. 腾讯云 版权所有
深圳市腾讯计算机系统有限公司 ICP备案/许可证号:粤B2-20090059 ![]() 粤公网安备44030502008569号
粤公网安备44030502008569号
腾讯云计算(北京)有限责任公司 京ICP证150476号 | 京ICP备11018762号