
如何在闪亮的应用程序中修改情节大小?
如何在闪亮的应用程序中修改情节大小?
提问于 2022-03-19 22:13:59
我创建了一个闪亮的应用程序,展示了几种情节类型。然而,地块是从顶部剪下来的,而且太宽了。我尝试修改plotOutput函数中的宽度和高度,但没有工作。
我的代码:
ui <- fluidPage(theme = shinytheme('united'),
  titlePanel(title = h3("Graphs - ordered chronologically", align="center")),
  selectInput("Plot",
              "Choose what plots to present",
              choices = list(Heatmap = "Heatmap", PCA = "PCA", VolcanoPlot = "VolcanoPlot", GSEA = 'GSEA')),
  submitButton(text = "Show plots"),
  verticalLayout( plotOutput(outputId = "PART.1", width = '70%'))
)
这个问题在热图和火山图中最为突出。火山的地块是从山顶切下来的,热图太宽了。
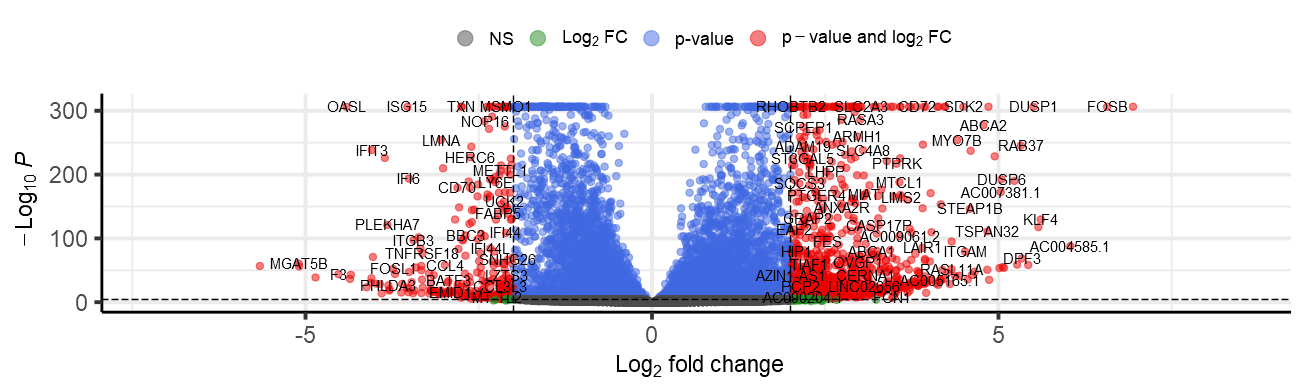
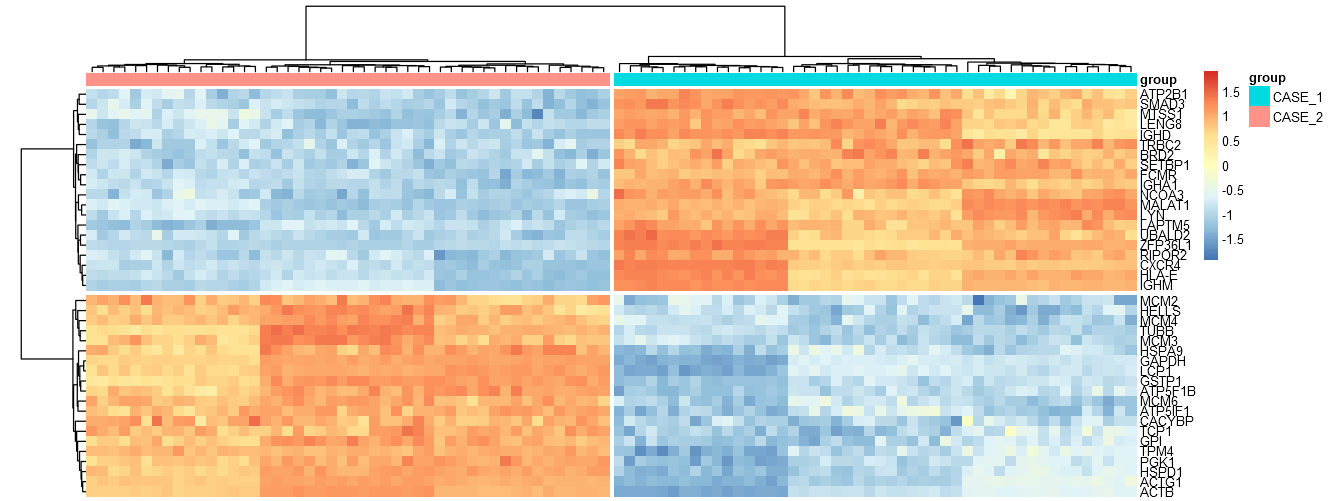
我怎么才能解决这个问题?谢谢。
编辑:
我的代码的最低版本:
    library(data.table)
    library(dplyr)
    library(shiny)
    library(shinythemes)
    library(plotly)
    library(compGenomRData)
    library(BiocManager)
    library(DESeq2)
    library(org.Hs.eg.db)
    library(TxDb.Hsapiens.UCSC.hg19.knownGene)
    library(EnsDb.Hsapiens.v86)
    library(AnnotationHub)
    library(AnnotationDbi)
    library(pheatmap)
    library(EnhancedVolcano)
    library(ggplot2)
    library(FactoMineR)
    library(devtools)
    library(clusterProfiler)
    library(ggnewscale)
    library(enrichplot)
    library(msigdbr)
    library(readxl)
      library(ExperimentHub)
    library(annotate)

    ui <- fluidPage(theme = shinytheme('united'),
      titlePanel(title = h3("Graphs - ordered chronologically", align="center")),
      selectInput("Plot",
                  "Choose which plots to present",
                  choices = list(Heatmap = "Heatmap", PCA = "PCA", VolcanoPlot = "VolcanoPlot", GSEA = 'GSEA')),
      submitButton(text = "Show plots"),
      verticalLayout( plotOutput(outputId = "PART.1", width = '70%'),
      plotOutput(outputId = "PART.2", width = '70%'),
      plotOutput(outputId = "PART.3", width = '70%'),
      plotOutput(outputId = "PART.4", width = '70%'),
      plotOutput(outputId = "PART.5", width = '70%'),
      plotOutput(outputId = "PART.6", width = '70%'),
      plotOutput(outputId = "PART.7", width = '70%'))
    )

    server <- function(input, output) {


      # RNA-seq data
      raw_counts <- frea
    d('E-MTAB-7805-raw-counts.tsv', data.table = F)
      metadata <- fread('E-MTAB-7805-experiment-design.tsv' ,data.table = F)


      A=duplicated(raw_counts$`Gene ID`) # Check for duplicates and remove them
      raw_counts = raw_counts[!A,]
      A=duplicated(raw_counts$`Gene Name`) # Check for duplicates and remove them
      raw_counts = raw_counts[!A,]


      Hugo.Symbol <- raw_counts[,c(1:2)]
      rownames(raw_counts) <- raw_counts$`Gene Name` # renaming rownames
      raw_counts <- raw_counts[, -c(1:2)]

      # metadata
      C = duplicated(metadata$Run) # Check for duplicates and remove them
      metadata = metadata[!C,]

      rownames(metadata) <- metadata$Run
      metadata <- metadata[,-1]

      ind <- order(colnames(raw_counts), rownames(metadata))
      raw_counts <- raw_counts[,ind]


  # filter
  target1 <- c("0 day", "1 day")
  Meta_filter1 <- metadata %>% dplyr::filter(`Factor Value[time]` %in%  target1)
  Counts_filter1 <- raw_counts[intersect(names(raw_counts), rownames(Meta_filter1))]
  rownames(Counts_filter1) <- Hugo.Symbol$`Gene Name`


  # annotate
  Meta_filter1$group <- plyr::mapvalues(Meta_filter1$`Factor Value[time]`, c("0 day", "1 day"),
                                        c("CTRL", "CASE"))
  ind <- order(colnames(Counts_filter1), rownames(Meta_filter1))
  Counts_filter1 <- Counts_filter1[,ind]


      dds <- DESeqDataSetFromMatrix(countData =  Counts_filter1,
                                     colData =  Meta_filter1,
                                     design = ~ group)

      dds = DESeq(dds)

      res = results(dds)
      res$symbol <- rownames(res)
      resOrder <- res[order(res$padj),]


      # heatmap
      dds.symbol = dds
      rownames(dds.symbol) = mapIds(org.Hs.eg.db,
                                    keys=rownames(dds),
                                    column="SYMBOL",
                                    keytype="SYMBOL",
                                    multiVals="first")
      rownames(dds.symbol)[is.na(rownames(dds.symbol))] = rownames(dds)[is.na(rownames(dds.symbol))]
      rownames(dds.symbol) = make.unique(rownames(dds.symbol))

      selectUp <- resOrder$symbol[resOrder$log2FoldChange>0][1:20]
      selectDown <- resOrder$symbol[resOrder$log2FoldChange<0][1:20]
      select = c(selectUp,selectDown)
      df <- data.frame(row.names = colnames(dds.symbol),
                       group = colData(dds.symbol)$group)

      normcounts = assay(vst(dds.symbol,blind=T, nsub = 2000))


      # Functional enrichment
      res = res[!is.na(res1$padj),]
      mygenes <- rownames(res)

      lfc = res1$log2FoldChange # get gene symbol
      names(lfc) <- rownames(res)
      lfc <- sort(lfc, decreasing = TRUE)

      hallmarks <- msigdbr(species = "Homo sapiens", category = "H") %>%
        dplyr::select(gs_name, gene_symbol)

    ## Output

      output$PART.1 <- renderPlot({
        if (input$Plot == 'Heatmap') {

          pheatmap(normcounts[select,], cluster_rows=TRUE,
                         show_colnames = FALSE,cluster_cols=TRUE,
                         annotation_col=df, scale = 'row',cutree_cols = 2,cutree_rows = 2)


        } else if (input$Plot == 'PCA') {
          Var <- apply(normcounts, 1, var)
          selectedVarGenes <- names(Var[order(Var, decreasing = T)][1:1000])
          M <- t(normcounts[selectedVarGenes,])
          pcaResults = prcomp(M)
          qplot(pcaResults$x[,1],pcaResults$x[,2], col=dds1$group,size=2)


        } else if (input$Plot == 'VolcanoPlot') {


          EnhancedVolcano(resOrder,
                          lab = resOrder$symbol,
                          x = 'log2FoldChange',
                          y = 'padj',
                          labSize=4,
                          FCcutoff=2 )


        } else  {
          em <- GSEA(lfc, TERM2GENE = hallmarks)
          dotplot(em)


        }

      })

shinyApp(ui = ui, server = server)回答 1
Stack Overflow用户
发布于 2022-03-23 14:20:47
如果在调用par之前包括对pheatmap的调用,可能会有所帮助:
par(mar=c(5,4,6,2)) # bottom, left, top, right
pheatmap(
    normcounts[select,], cluster_rows=TRUE,
    show_colnames = FALSE, cluster_cols=TRUE,
    annotation_col=df, scale = 'row',
    cutree_cols = 2,cutree_rows = 2
)页面原文内容由Stack Overflow提供。腾讯云小微IT领域专用引擎提供翻译支持
原文链接:
https://stackoverflow.com/questions/71542515
复制相关文章
相似问题
腾讯云开发者

Copyright © 2013 - 2026 Tencent Cloud. All Rights Reserved. 腾讯云 版权所有
深圳市腾讯计算机系统有限公司 ICP备案/许可证号:粤B2-20090059 ![]() 粤公网安备44030502008569号
粤公网安备44030502008569号
腾讯云计算(北京)有限责任公司 京ICP证150476号 | 京ICP备11018762号