
需要帮助在R中使用Excel数据
我刚刚开始使用R并导入一个名为tblMainXmasFund.xlsx的Excel文件。我可以用
readxl::read_excel("C:/Excel/For R/tblMainXmasFund.xlsx"). 然而,当我尝试做像sum(Amount)这样的计算时,我得到:
错误:找不到对象“数量”。如果我使用
sum("Amount"),我得到:无效的参数'type‘(字符)。
R将Amount列识别为数值(实际上是双),所以我猜我需要修改语法,但不知道是什么。
我将使用的只有两列数据(CheckDate和Amount),因此想知道进行像sum(Amount)这样的计算的代码,其中CheckDate >=10/1/2022和<=12/31/2022。感谢您的所有建议。
回答 1
Stack Overflow用户
发布于 2022-03-19 02:51:22
很难确切知道到底是怎么回事,但这是我最好的猜测。我在Excel中创建了这个3x2表,以模仿您的表:
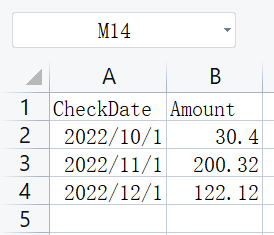
然后,通过加载readxl包加载工作表,将其保存到R中,将其保存为数据帧,然后对Amount变量运行sum:
# Load library for excel functions:
library(readxl)

# Save excel sheet into data frame:
df <- read_excel("slack.xlsx")

# Run sum of Amount:
sum(df$Amount)
如下所示:
> sum(df$Amount)
[1] 352.84
编辑
根据下面的注释,您可以使用以下代码总结CheckDate值:
library(tidyverse)

reconstruct %>%
  mutate(CheckDate = as.character(CheckDate)) %>%
  group_by(CheckDate) %>%
  summarise(Total = sum(Amount))
它按日期给出了这些汇总的值:
# A tibble: 6 x 2
  CheckDate  Total
  <chr>      <dbl>
1 2020-10-15  2800
2 2020-10-16  1500
3 2020-10-17  1000
4 2020-10-19  3600
5 2020-10-20  2450
6 2020-10-21  1700
要绘制这些图形,您可以使用以下基本代码,它只是添加了ggplot和geombar命令:
reconstruct %>%
  mutate(CheckDate = as.character(CheckDate)) %>%
  group_by(CheckDate) %>%
  summarise(Total = sum(Amount)) %>%
  ggplot(aes(x=CheckDate,
             weight=Total))+
  geom_bar()
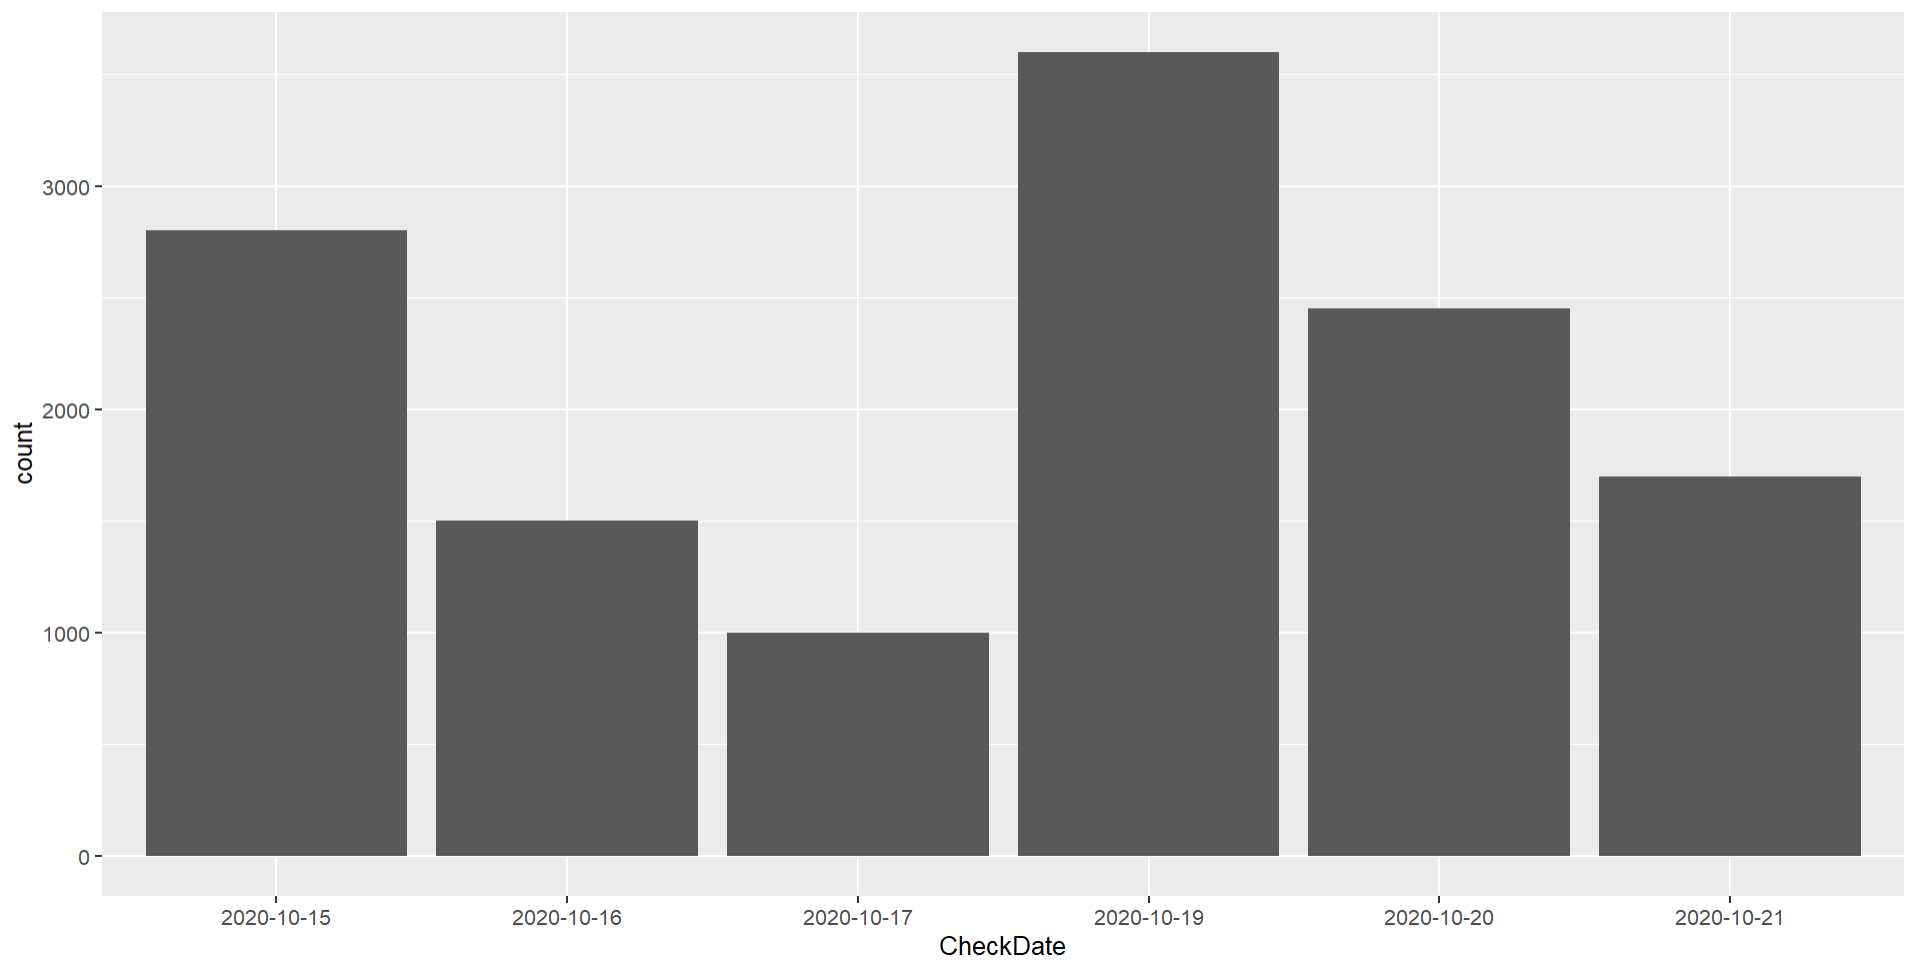
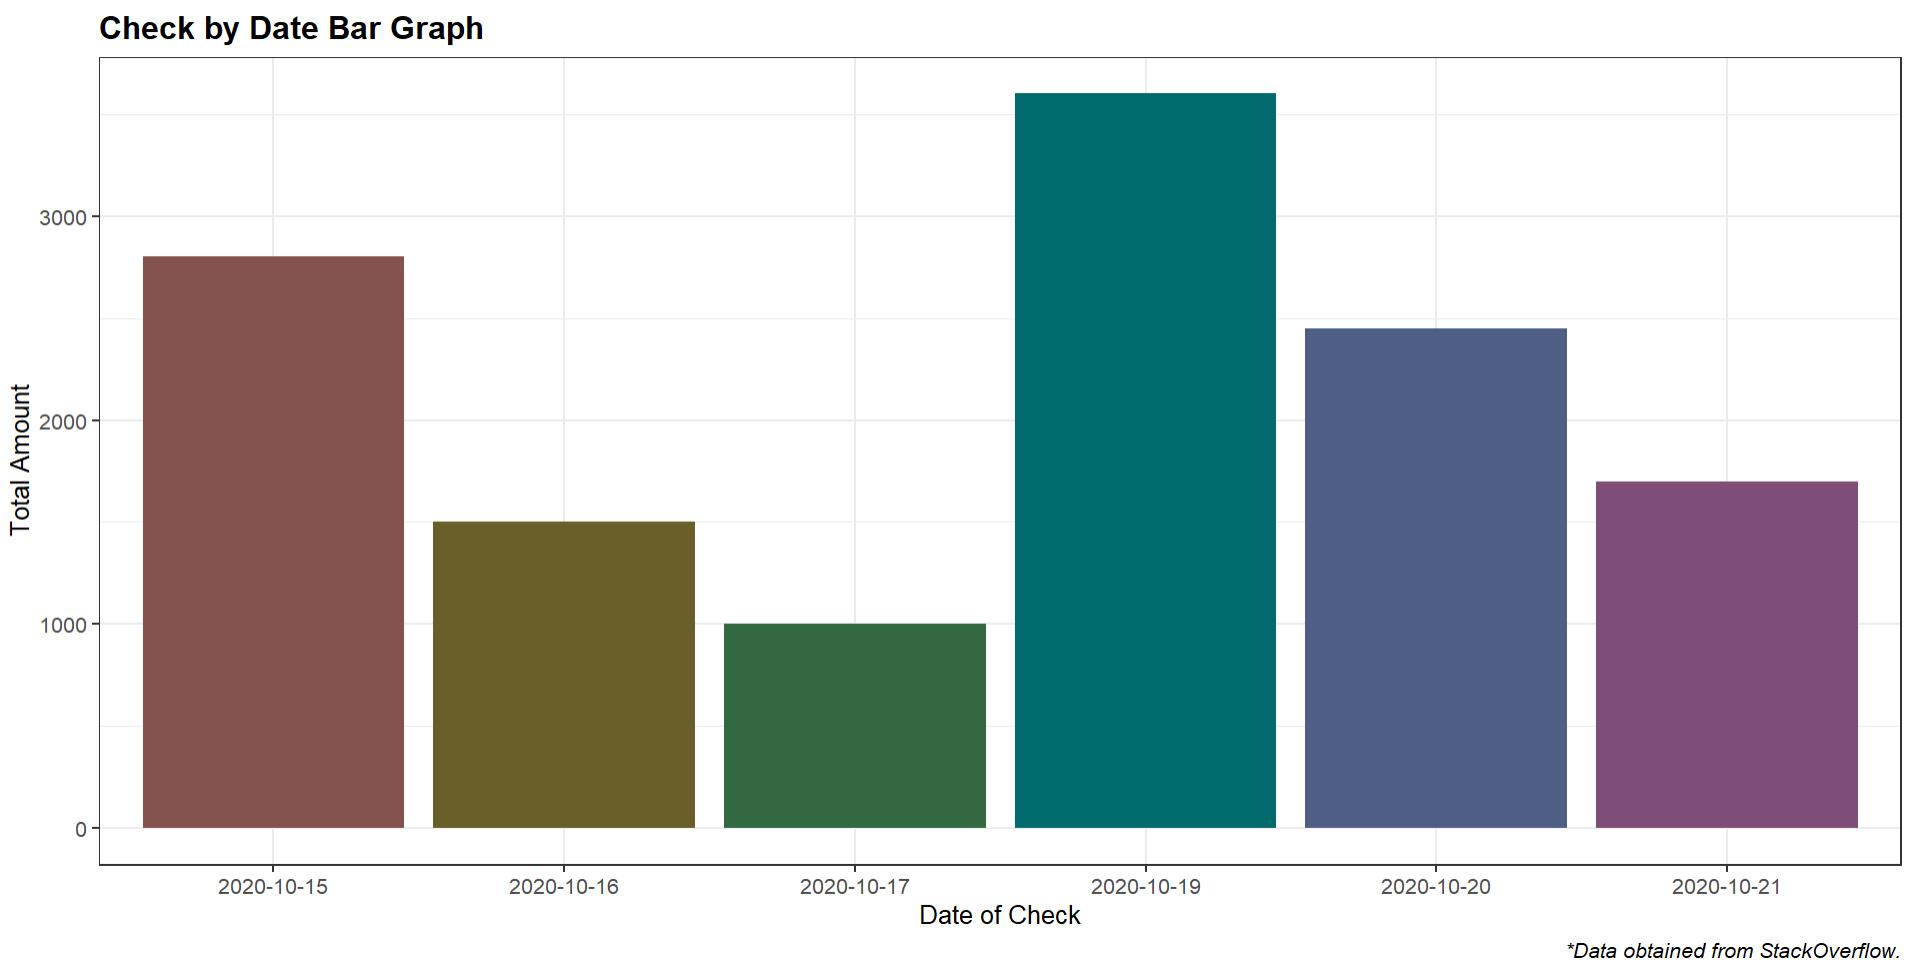
如果您想让它变得更时尚一点,您也可以使用以下方法:
reconstruct %>%
  mutate(CheckDate = as.character(CheckDate)) %>%
  group_by(CheckDate) %>%
  summarise(Total = sum(Amount)) %>%
  ggplot(aes(x=CheckDate,
             weight=Total,
             fill = CheckDate))+
  geom_bar()+
  theme_bw()+
  labs(title = "Check by Date Bar Graph",
       x = "Date of Check",
       y = "Total Amount",
       caption = "*Data obtained from StackOverflow.")+
  theme(legend.position = "none",
        plot.title = element_text(face = "bold"),
        plot.caption = element_text(face = "italic"))+
  scale_fill_hue(l=40, c=35)
这给了你更多的色彩:
https://stackoverflow.com/questions/71533959
复制相似问题
腾讯云开发者

Copyright © 2013 - 2026 Tencent Cloud. All Rights Reserved. 腾讯云 版权所有
深圳市腾讯计算机系统有限公司 ICP备案/许可证号:粤B2-20090059  粤公网安备44030502008569号
腾讯云计算(北京)有限责任公司 京ICP证150476号 | 京ICP备11018762号