
如何在ggnewscale中修复图例顺序
如何在ggnewscale中修复图例顺序
提问于 2022-03-15 07:04:52
我用这段代码生成的图给了我这个图
问题是我无法与情节中的顺序相匹配
我的代码
p <- df %>%
  ggplot(aes(name, perc)) +
  geom_col(data = ~ filter(.x, name == "FAB") %>% rename(FAB = value), mapping = aes(fill = FAB)) +
  #scale_fill_manual(values = cols)+
  new_scale_fill() +
    geom_col(data = ~ filter(.x, name == "Sex") %>% rename(Sex = value), mapping = aes(fill = Sex)) +
  new_scale_fill() +
  geom_col(data = ~ filter(.x, name == "Age") %>% rename(Age = value), mapping = aes(fill = Age)) +
  new_scale_fill() +
  geom_col(data = ~ filter(.x, name == "BM_percentage") %>% rename(BM_percentage = value), mapping = aes(fill = BM_percentage)) +

  coord_flip()+theme_bw(base_size=30)+
  theme(axis.text.x=element_text(angle = 45, size=45, face="bold", hjust = 1), legend.position = "right",
        axis.text.y=element_text(angle=0, size=40, face="bold", vjust=0.5),
        plot.title = element_text(size=40, face="bold"),
        legend.title=element_text(size=20),
        legend.key.size=unit(1, "cm"),      #Sets overall area/size of the legend
        legend.text=element_text(size=40))
p+scale_fill_manual(values=rainbow(8),guide = guide_legend(order = 1))
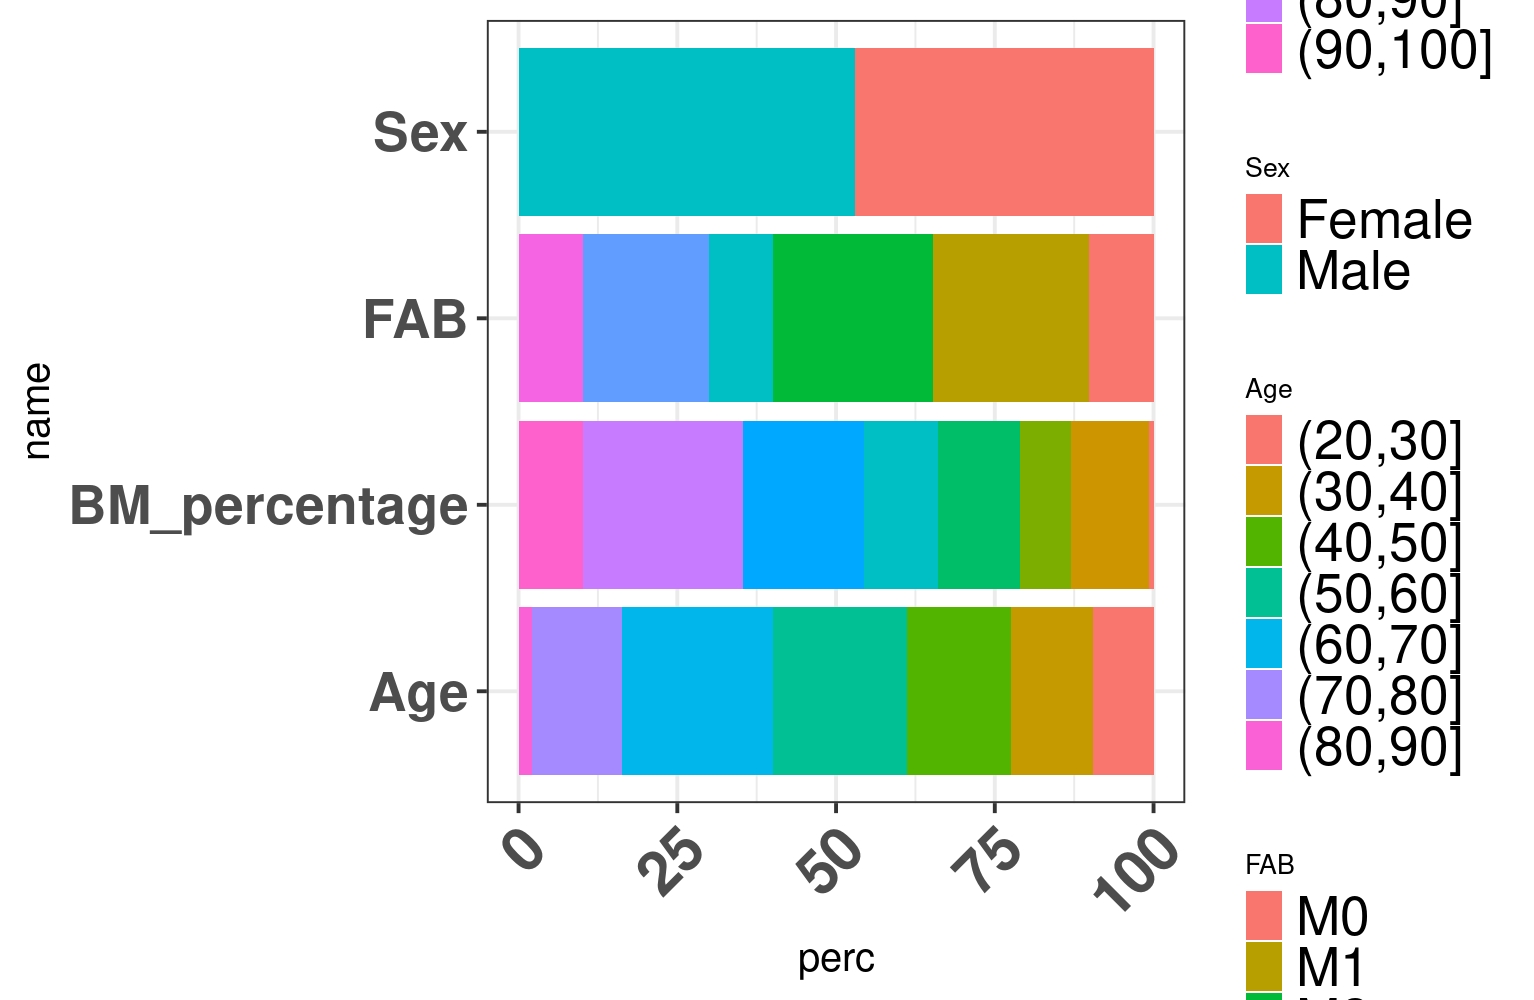
这一行代码我累了,但没有改变我的顺序。
guide = guide_legend(order = 1)如果您能提供任何建议或帮助,我们将非常感谢您如何修复传说中的订单。
回答 1
Stack Overflow用户
回答已采纳
发布于 2022-03-15 07:26:15
问题是,您只为您的一个填充刻度设置了订单,即您最后添加的填充刻度,也就是BM_percentage的填充刻度。正如你对order=1的要求,这个传说被放在最上面。
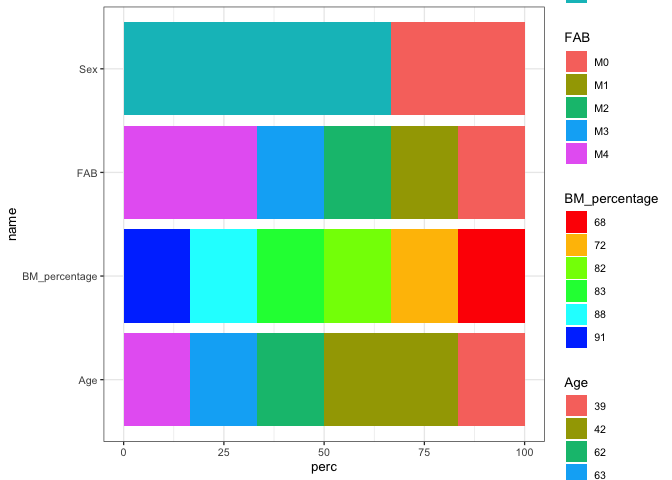
要将图例按y轴类别的顺序排列,必须为四个填充刻度中的每一个设置顺序,这需要在使用默认填充刻度的情况下显式添加一个scale_fill_discrete:
使用你们中的一个老帖子的数据:
library(ggplot2)
library(ggnewscale)
library(dplyr)

ggplot(df, aes(name, perc)) +
  geom_col(data = ~ filter(.x, name == "FAB") %>% rename(FAB = value), mapping = aes(fill = FAB)) +
  scale_fill_discrete(guide = guide_legend(order = 2)) +
  new_scale_fill() +
  geom_col(data = ~ filter(.x, name == "Sex") %>% rename(Sex = value), mapping = aes(fill = Sex)) +
  scale_fill_discrete(guide = guide_legend(order = 1)) +
  new_scale_fill() +
  geom_col(data = ~ filter(.x, name == "Age") %>% rename(Age = value), mapping = aes(fill = Age)) +
  scale_fill_discrete(guide = guide_legend(order = 4)) +
  new_scale_fill() +
  geom_col(data = ~ filter(.x, name == "BM_percentage") %>% rename(BM_percentage = value), mapping = aes(fill = BM_percentage)) +
  scale_fill_manual(values = rainbow(8), guide = guide_legend(order = 3)) +
  coord_flip() +
  theme_bw(base_size = 10)
数据
df <- structure(list(name = c(
  "Age", "Age", "Age", "Age", "Age", "BM_percentage",
  "BM_percentage", "BM_percentage", "BM_percentage", "BM_percentage",
  "BM_percentage", "Cytogenetic-Code--Other-", "Cytogenetic-Code--Other-",
  "Cytogenetic-Code--Other-", "Cytogenetics", "Cytogenetics", "Cytogenetics",
  "Cytogenetics", "Cytogenetics", "Cytogenetics", "FAB", "FAB",
  "FAB", "FAB", "FAB", "Induction", "Induction", "Induction", "Induction",
  "Induction", "patient", "patient", "patient", "patient", "patient",
  "patient", "Sex", "Sex"
), value = c(
  "39", "42", "62", "63", "76",
  "68", "72", "82", "83", "88", "91", "Complex Cytogenetics", "Normal Karyotype",
  "PML-RARA", "45,XY,der(7)(t:7;12)(p11.1;p11.2),-12,-13,+mar[19]/46,XY[1]",
  "46, XX[20]", "46,XX[20]", "46,XY,del(9)(q13:q22),t(11:21)(p13;q22),t(15;17)(q22;q210[20]",
  "46,XY[20]", "47,XY,del(5)(q22q33),t(10;11)(p13~p15;q22~23),i(17)(q10)[3]/46,XY[17]",
  "M0", "M1", "M2", "M3", "M4", "7+3", "7+3+3", "7+3+AMD", "7+3+ATRA",
  "7+3+Genasense", "TCGA-AB-2849", "TCGA-AB-2856", "TCGA-AB-2872",
  "TCGA-AB-2891", "TCGA-AB-2930", "TCGA-AB-2971", "Female", "Male"
), n = c(
  1L, 2L, 1L, 1L, 1L, 1L, 1L, 1L, 1L, 1L, 1L, 2L, 3L,
  1L, 1L, 1L, 1L, 1L, 1L, 1L, 1L, 1L, 1L, 1L, 2L, 1L, 2L, 1L, 1L,
  1L, 1L, 1L, 1L, 1L, 1L, 1L, 2L, 4L
), perc = c(
  16.6666666666667,
  33.3333333333333, 16.6666666666667, 16.6666666666667, 16.6666666666667,
  16.6666666666667, 16.6666666666667, 16.6666666666667, 16.6666666666667,
  16.6666666666667, 16.6666666666667, 33.3333333333333, 50, 16.6666666666667,
  16.6666666666667, 16.6666666666667, 16.6666666666667, 16.6666666666667,
  16.6666666666667, 16.6666666666667, 16.6666666666667, 16.6666666666667,
  16.6666666666667, 16.6666666666667, 33.3333333333333, 16.6666666666667,
  33.3333333333333, 16.6666666666667, 16.6666666666667, 16.6666666666667,
  16.6666666666667, 16.6666666666667, 16.6666666666667, 16.6666666666667,
  16.6666666666667, 16.6666666666667, 33.3333333333333, 66.6666666666667
)), class = c("grouped_df", "tbl_df", "tbl", "data.frame"), row.names = c(
  NA,
  -38L
), groups = structure(list(name = c(
  "Age", "BM_percentage",
  "Cytogenetic-Code--Other-", "Cytogenetics", "FAB", "Induction",
  "patient", "Sex"
), .rows = structure(list(
  1:5, 6:11, 12:14, 15:20,
  21:25, 26:30, 31:36, 37:38
), ptype = integer(0), class = c(
  "vctrs_list_of",
  "vctrs_vctr", "list"
))), class = c("tbl_df", "tbl", "data.frame"), row.names = c(NA, -8L), .drop = TRUE))页面原文内容由Stack Overflow提供。腾讯云小微IT领域专用引擎提供翻译支持
原文链接:
https://stackoverflow.com/questions/71478164
复制相关文章
相似问题
腾讯云开发者

Copyright © 2013 - 2026 Tencent Cloud. All Rights Reserved. 腾讯云 版权所有
深圳市腾讯计算机系统有限公司 ICP备案/许可证号:粤B2-20090059 ![]() 粤公网安备44030502008569号
粤公网安备44030502008569号
腾讯云计算(北京)有限责任公司 京ICP证150476号 | 京ICP备11018762号