
使用geom_abline()的奇怪行为
使用geom_abline()的奇怪行为
提问于 2022-03-07 17:29:21
我正在使用以下代码:
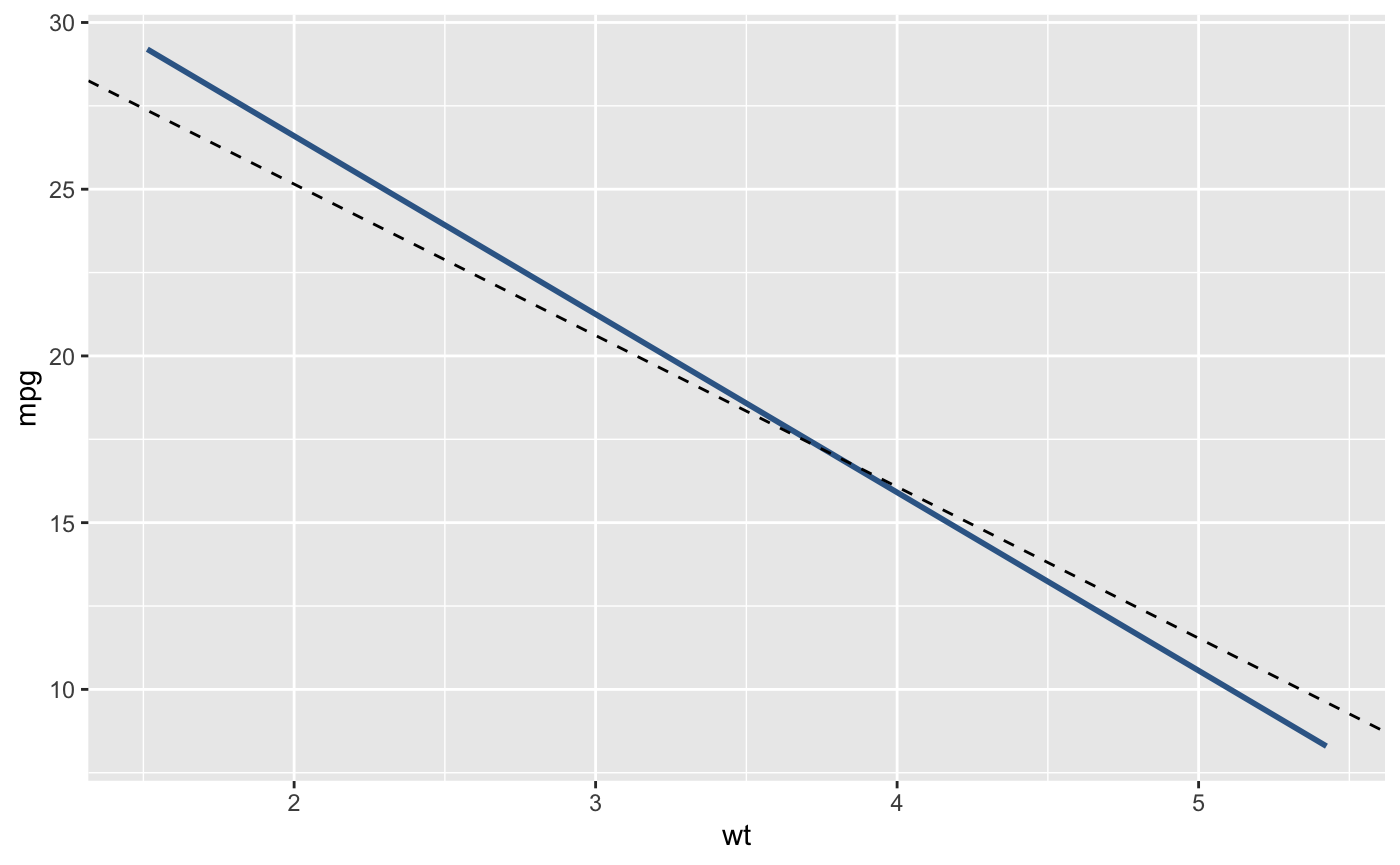
ggplot(mtcars, aes(x = wt, y = mpg)) +
  geom_smooth(method = "lm", se = FALSE, color = '#376795', size = 1) +
  geom_abline(intercept = 34.232237, slope = -4.539474, linetype = 'dashed')
我得到了这张图:
然后我用命令+ shift +c注释掉了代码的中间行。
ggplot(mtcars, aes(x = wt, y = mpg)) +
  # geom_smooth(method = "lm", se = FALSE, color = '#376795', size = 1) +
  geom_abline(intercept = 34.232237, slope = -4.539474, linetype = 'dashed')
我得到一个没有线的图形。从geom_abline()到哪里去了?

然后我就换了订单小心那些+符号..。
ggplot(mtcars, aes(x = wt, y = mpg)) +
  geom_abline(intercept = 34.232237, slope = -4.539474, linetype = 'dashed') +
  geom_smooth(method = "lm", se = FALSE, color = '#376795', size = 1)
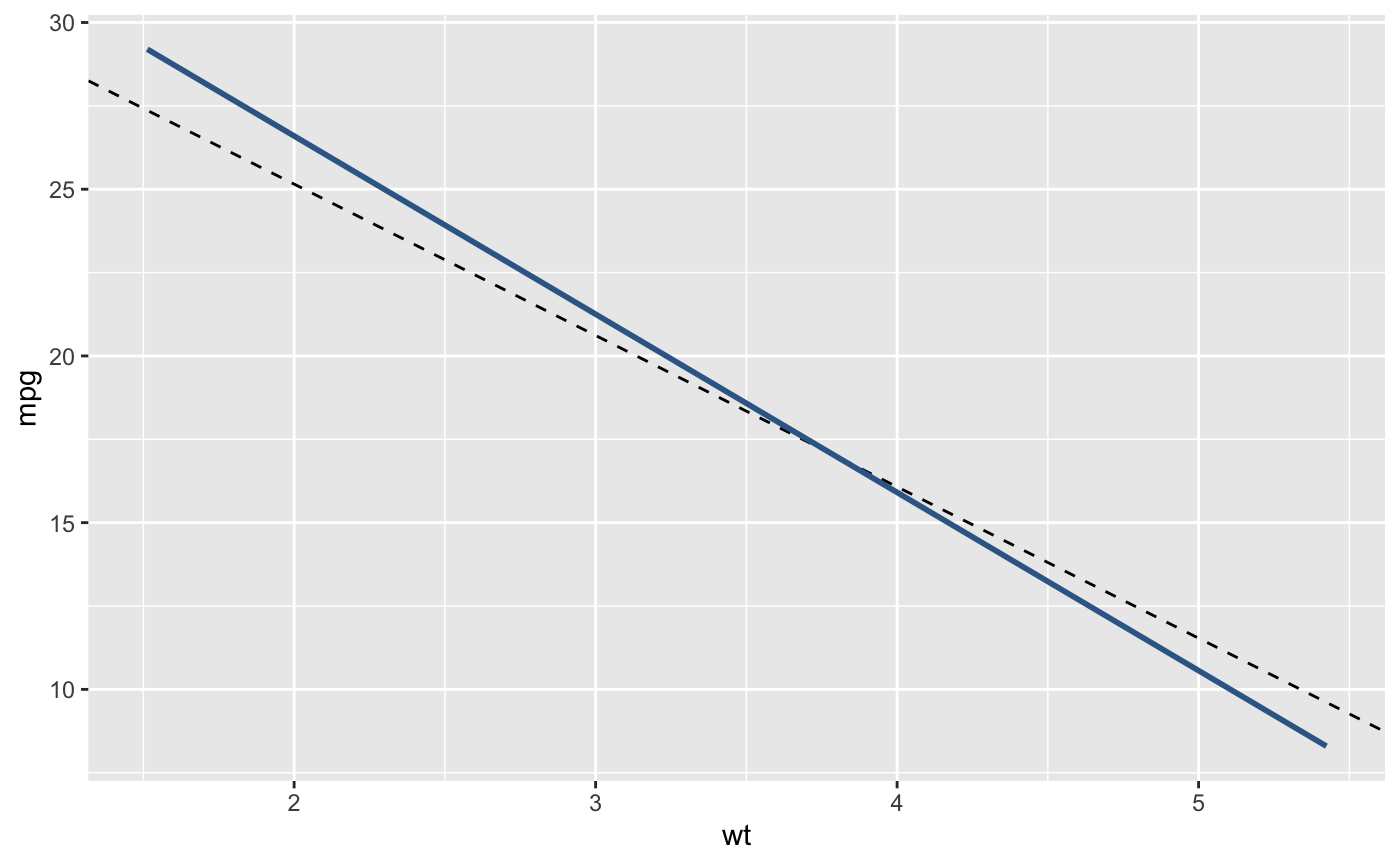
两条线都回来了。所以geom_abline()的代码看起来很好,对吧?
然后,我评论一下中间的一行:
ggplot(mtcars, aes(x = wt, y = mpg)) +
  # geom_abline(intercept = 34.232237, slope = -4.539474, linetype = 'dashed') +
  geom_smooth(method = "lm", se = FALSE, color = '#376795', size = 1)
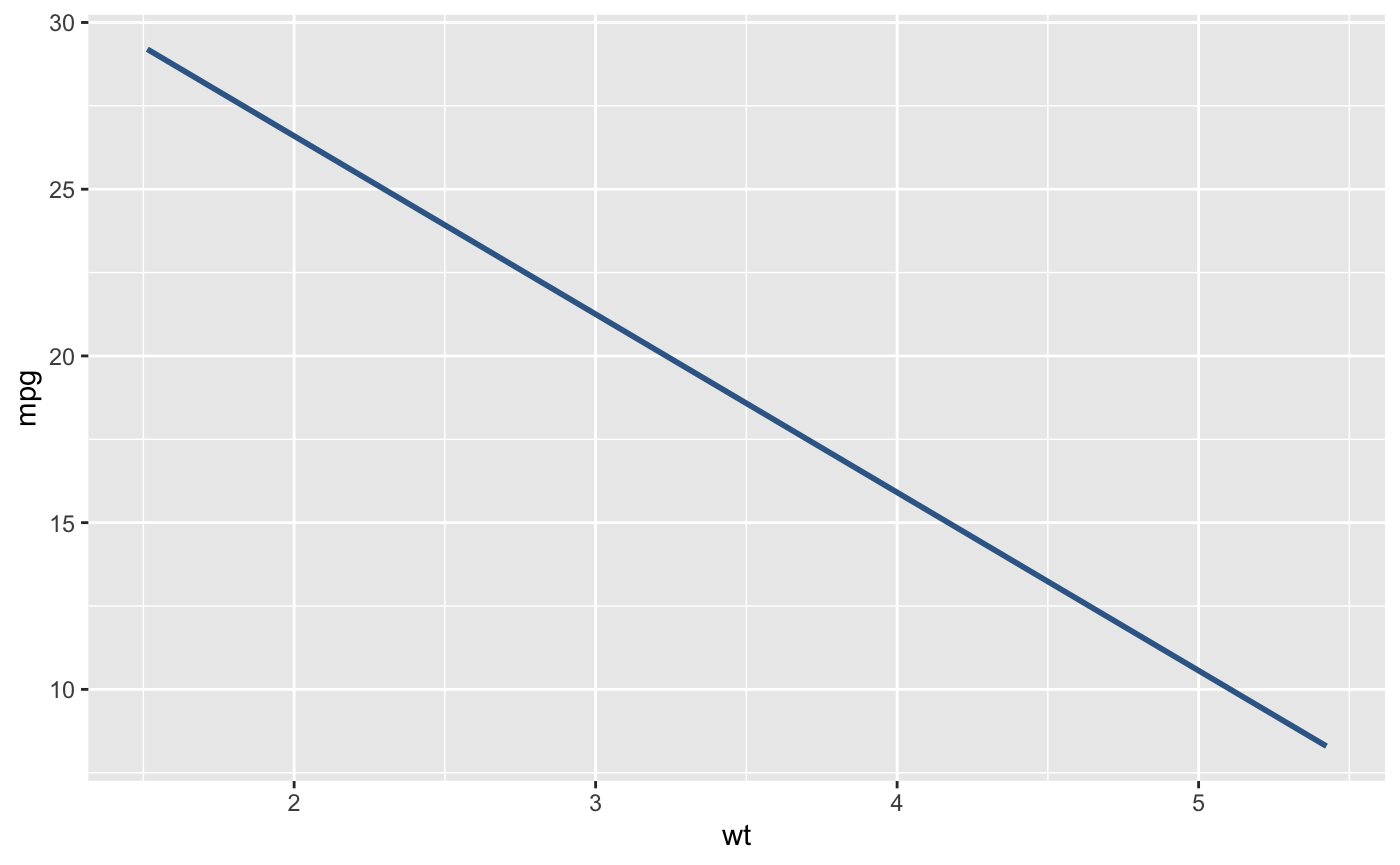
geom_smooth()在那里,但没有not。我真的被这种行为弄糊涂了。我只想要and,而不是顺利,但这是行不通的:
ggplot(mtcars, aes(x = wt, y = mpg)) +
  geom_abline(intercept = 34.232237, slope = -4.539474, linetype = 'dashed')
一定有一个简单的理由。但同时-为什么行为不一致?这就像一个bug,因为同一代码在一个地方似乎工作,而在另一个地方不工作。
回答 1
Stack Overflow用户
回答已采纳
发布于 2022-03-07 17:37:26
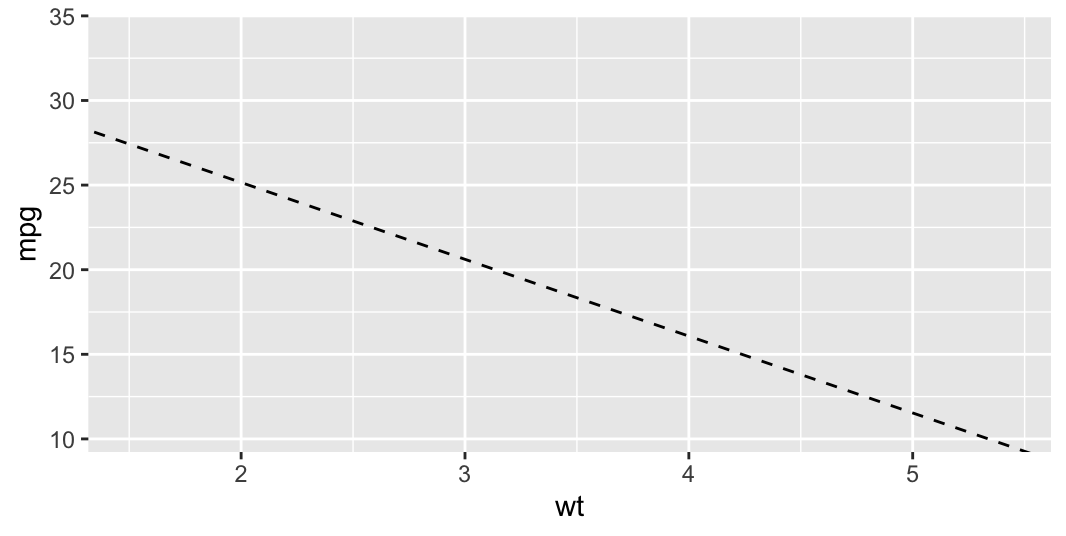
您可以使用此代码只绘制You:
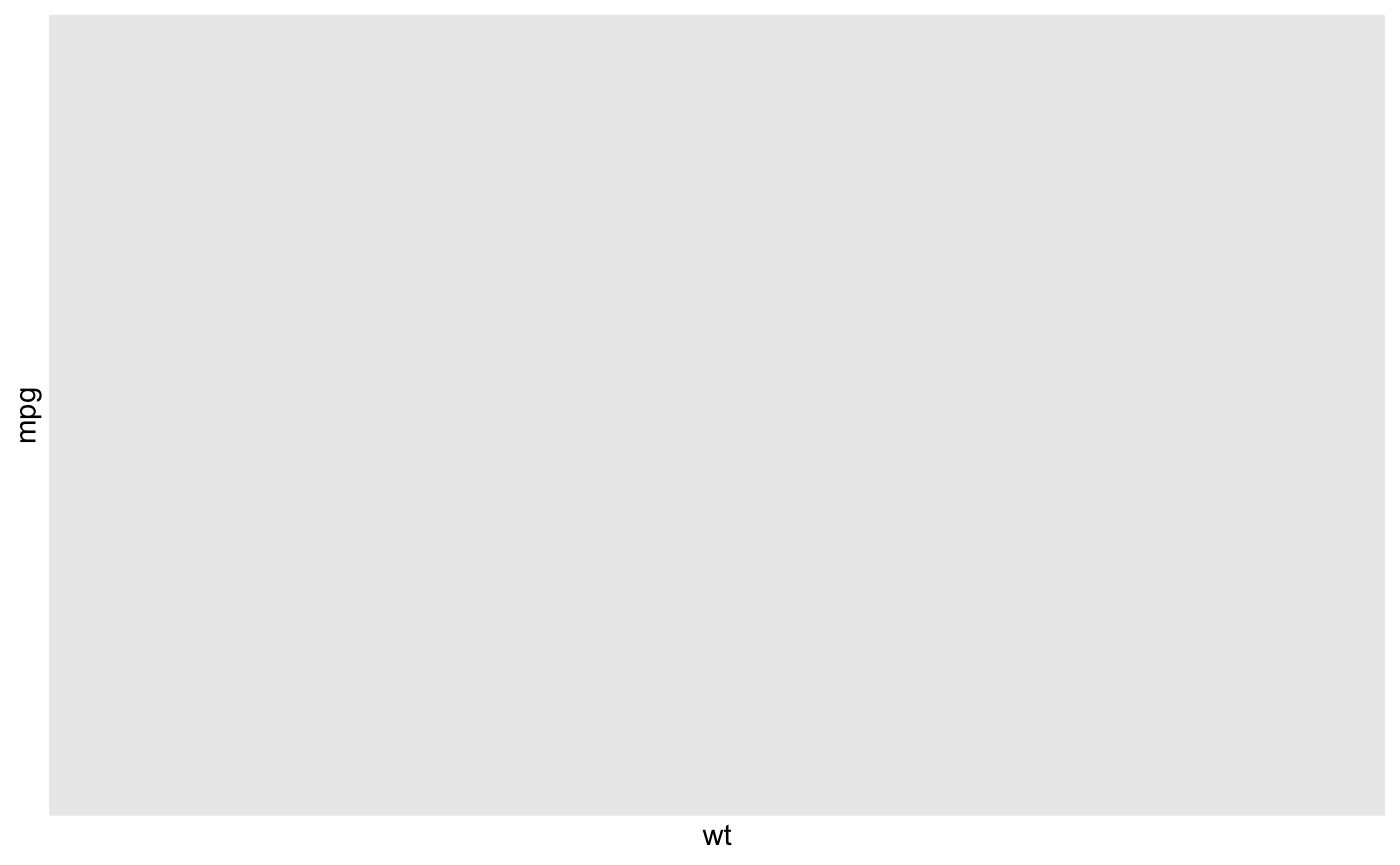
ggplot(mtcars, aes(x = wt, y = mpg)) +
  geom_blank() +
  geom_abline(intercept = 34.232237, slope = -4.539474, linetype = 'dashed')
输出:
页面原文内容由Stack Overflow提供。腾讯云小微IT领域专用引擎提供翻译支持
原文链接:
https://stackoverflow.com/questions/71385017
复制相关文章
相似问题
腾讯云开发者

Copyright © 2013 - 2026 Tencent Cloud. All Rights Reserved. 腾讯云 版权所有
深圳市腾讯计算机系统有限公司 ICP备案/许可证号:粤B2-20090059 ![]() 粤公网安备44030502008569号
粤公网安备44030502008569号
腾讯云计算(北京)有限责任公司 京ICP证150476号 | 京ICP备11018762号