
如何使y轴标签水平而使y轴标题保持平行?
如何使y轴标签水平而使y轴标题保持平行?
提问于 2022-03-06 05:08:07
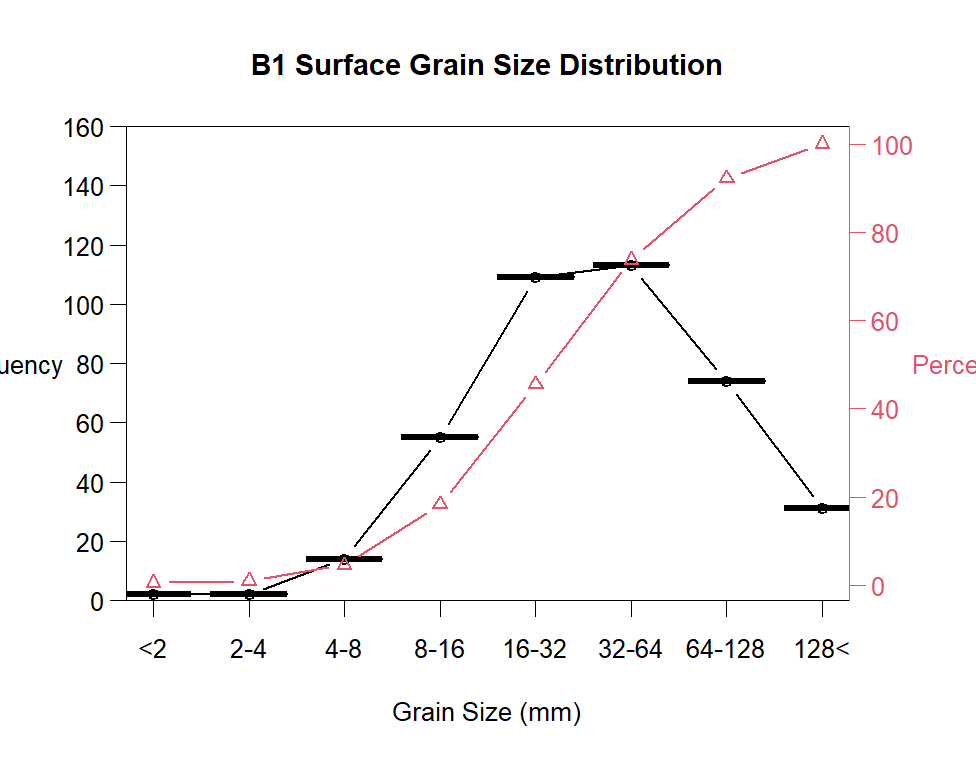
我想使我的y轴标签水平,同时保持我的y轴标题平行。当我尝试将las=1输入到twoor.plot()参数时,什么都不会发生。我也尝试过ylas=1,y_las=1,lylas=1,rylas=1,但是什么都没发生。我唯一能使yaxis标签水平的方法是使用par(las=1),但是这样做我的y轴标题也是水平的,我不想.
到目前为止,这是我的代码:
  par(las=1)
    yFrequency <- c(0,20,40,60,80,100,120,140,160)
    GS_class_labels <- c("<2", "2-4", "4-8", "8-16", "16-32", "32-64", "64-128", "128<")
    twoord.plot(data=distribution,lx="Var1",ly="Freq", ry="cum_percentile",
                main="B1 Surface Grain Size Distribution",
                xlim=NULL,lylim=c(0,160),rylim=NULL,lwd=1.5,
                lcol=1,rcol=2,xlab="Grain Size (mm)",lytickpos=yFrequency,
                ylab="Frequency",ylab.at=NA,
                rytickpos=NA,rylab="Percent Finer Than (%)",rylab.at=NA,
                lpch=1,rpch=2,
                type="b",xtickpos=NULL,xticklab=GS_class_labels,
                halfwidth=0.4,axislab.cex=1.1,
                do.first=NULL,xaxt="s", yticklab=yFrequency, cex.lab=1)
回答 1
Stack Overflow用户
回答已采纳
发布于 2022-03-06 07:24:20
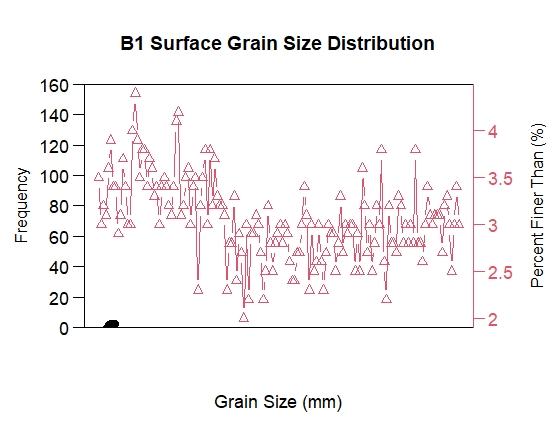
另一种设置y轴标签并行的方法如下所示。(1)将ylab和rylab从twoord.plot设置为空。(2)使用mtext并设置相应的参数。
下面是这样做的代码。因为您没有提供distribution数据,所以我使用iris数据只是为了使生成绘图成为可能。
# Emptying both of ylab and rylab

twoord.plot(data = iris,lx="Sepal.Length",ly="Petal.Width", ry="Sepal.Width",
            main="B1 Surface Grain Size Distribution",
            xlim=NULL,lylim=c(0,160),rylim=NULL,lwd=1.5,
            lcol=1,rcol=2,xlab="Grain Size (mm)",lytickpos=yFrequency,
            ylab="",ylab.at=NA,
            rytickpos=NA,rylab="",rylab.at=NA,
            lpch=1,rpch=2,
            type="b",xtickpos=NULL,xticklab=GS_class_labels,
            halfwidth=0.4,axislab.cex=1.1,
            do.first=NULL,xaxt="n",yaxt="n", #yticklab=yFrequency,
            cex.lab=1)

# Assign the previous labels of ylab and rylab to the *text* parameter of *mtext*.
# side = 2 means the left side. side = 4 means the right side.
# las = 0 is the parallel style of the text.
# line shows the distance of the text from the y axis.

mtext(text = "Frequency", side = 2, las = 0, line = 2.5)
mtext(text = "Percent Finer Than (%)", side = 4, las = 0, line = 0.5)
由此产生的阴谋:
页面原文内容由Stack Overflow提供。腾讯云小微IT领域专用引擎提供翻译支持
原文链接:
https://stackoverflow.com/questions/71367831
复制相关文章
相似问题
腾讯云开发者

Copyright © 2013 - 2026 Tencent Cloud. All Rights Reserved. 腾讯云 版权所有
深圳市腾讯计算机系统有限公司 ICP备案/许可证号:粤B2-20090059 ![]() 粤公网安备44030502008569号
粤公网安备44030502008569号
腾讯云计算(北京)有限责任公司 京ICP证150476号 | 京ICP备11018762号