
在R中创建一个“囚徒困境表”
在R中创建一个“囚徒困境表”
提问于 2022-03-03 16:12:59
我正在使用R编程语言。我在R中创建了以下“游戏”,其中涉及两个玩家掷硬币(每个硬币的结果与一个“分数”相关),以查看谁的分数最高:
score_coin_1 = c(-1,1)

score_coin_2 = c(-3, 4)


results <- list()

for (i in 1:100)

{

iteration = i


player_1_coin_choice_i = sample(2, 1, replace = TRUE)
player_2_coin_choice_i = sample(2, 1, replace = TRUE)

player_1_result_i = ifelse(player_1_coin_choice_i == 1, sample(score_coin_1, size=1, prob=c(.5,.5)),  sample(score_coin_2, size=1, prob=c(.7,.3)) )
player_2_result_i = ifelse(player_2_coin_choice_i == 1, sample(score_coin_1, size=1, prob=c(.5,.5)), sample(score_coin_2, size=1, prob=c(.7,.3)))

winner_i = ifelse(player_1_result_i > player_2_result_i, "PLAYER_1", ifelse(player_1_result_i == player_2_result_i, "TIE", "PLAYER_2"))

my_data_i = data.frame(iteration, player_1_coin_choice_i, player_2_coin_choice_i, player_1_result_i, player_2_result_i , winner_i )

 results[[i]] <- my_data_i

}


results_df <- data.frame(do.call(rbind.data.frame, results))

head(results_df)
  iteration player_1_coin_choice_i player_2_coin_choice_i player_1_result_i player_2_result_i winner_i
1         1                      1                      1                -1                 1 PLAYER_2
2         2                      1                      2                -1                -3 PLAYER_1
3         3                      2                      2                 4                -3 PLAYER_1
4         4                      1                      2                 1                -3 PLAYER_1
5         5                      2                      1                 4                 1 PLAYER_1
6         6                      2                      2                 4                -3 PLAYER_1
然后,我提取了所有可能的结果的分数:
one_one <- results_df[which(results_df$player_1_coin_choice_i == 1 & results_df$player_2_coin_choice_i == 1), ]
one_two <- results_df[which(results_df$player_1_coin_choice_i == 1 & results_df$player_2_coin_choice_i == 2), ]
two_one <- results_df[which(results_df$player_1_coin_choice_i == 2 & results_df$player_2_coin_choice_i == 1), ]
two_two <- results_df[which(results_df$player_1_coin_choice_i == 2 & results_df$player_2_coin_choice_i == 2), ]

 library(dplyr)

    one_one_sum = data.frame(one_one %>%
      group_by(winner_i) %>%
      summarise(n = n()))

    one_two_sum = data.frame(one_two %>%
      group_by(winner_i) %>%
      summarise(n = n()))

    two_one_sum = data.frame(two_one %>%
      group_by(winner_i) %>%
      summarise(n = n()))

    two_two_sum = data.frame(two_two %>%
      group_by(winner_i) %>%
summarise(n = n()))在这里,我想做这样的桌子(“囚徒困境”:https://www.greenflux.com/wp-content/uploads/knowledge-sharing-the-prisoners-dilemma-1-1.jpg)
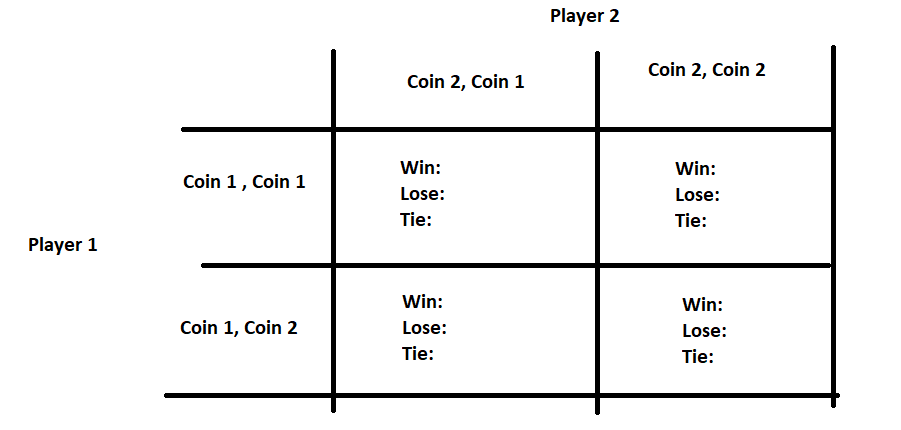
在这里,“硬币1,硬币1”意味着玩家1选择硬币1,玩家2也选择硬币1--“硬币2,硬币1”表示玩家1选择硬币2,玩家1选择硬币1等等。
我的问题:是否有可能在R中“直接”制作这个表?目前,我正在Microsoft和Powerpoint中创建这个表,但是可以直接在R中创建这个表吗?
谢谢!
回答 1
Stack Overflow用户
回答已采纳
发布于 2022-03-03 17:05:23
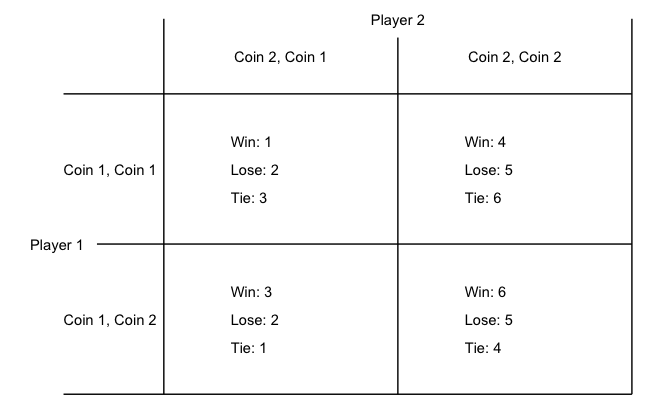
不确定如何将计算出来的收益转换为报酬矩阵,但有一种方法可以用ggplot2来实现。请注意,输入是一个包含元素ll、lr、ul、ur的列表,用于在左下角、右下角、左上角和右上象限中的赢、输和打成平局的收益。如果收益向量只有两个值,则不会打印领带标签。下面是一个例子:
library(ggplot2)

payoffs <- list(ul=c(1,2,3), ll = c(3,2,1), ur = c(4,5,6), lr = c(6,5,4))

pd_game <- function(payoffs, ...){
  ## payoffs should have elements ll, lr, ul, ur for lower-left
  ## lower-right, upper-left and upper-right quadrant payoffs
require(ggplot2)
g <- ggplot() +
  geom_segment(aes(y=0, yend=0, x=.15, xend=1)) +
  geom_segment(aes(y=.4, yend=.4, x=.2, xend=1)) +
  geom_segment(aes(y=.8, yend=.8, x=.15, xend=1)) +
  geom_segment(aes(y=0, yend=1, x=.3, xend=.3)) +
  geom_segment(aes(y=0, yend=.95, x=.65, xend=.65)) +
  geom_segment(aes(y=0, yend=1, x=1, xend=1)) +
  geom_text(aes(x=.15, y=.2, label="Coin 1, Coin 2"), hjust=0) +
  geom_text(aes(x=.15, y=.6, label="Coin 1, Coin 1"), hjust=0) +
  geom_text(aes(x=.475, y=.9, label="Coin 2, Coin 1"), hjust=0.5) +
  geom_text(aes(x=.825, y=.9, label="Coin 2, Coin 2"), hjust=0.5) +
  geom_text(aes(x=.4, y=.275, label=paste0("Win: ", payoffs$ll[1])), hjust=0) +
  geom_text(aes(x=.4, y=.2, label=paste0("Lose: ", payoffs$ll[2])), hjust=0) +
  geom_text(aes(x=.75, y=.275, label=paste0("Win: ", payoffs$lr[1])), hjust=0) +
  geom_text(aes(x=.75, y=.2, label=paste0("Lose: ", payoffs$lr[2])), hjust=0) +
  geom_text(aes(x=.4, y=.675, label=paste0("Win: ", payoffs$ul[1])), hjust=0) +
  geom_text(aes(x=.4, y=.6, label=paste0("Lose: ", payoffs$ul[2])), hjust=0) +
  geom_text(aes(x=.75, y=.675, label=paste0("Win: ", payoffs$ur[1])), hjust=0) +
  geom_text(aes(x=.75, y=.6, label=paste0("Lose: ", payoffs$ur[2])), hjust=0) +
  geom_text(aes(x=.1, y=.4, label="Player 1"), hjust=0) +
  geom_text(aes(x=.65, y=1, label="Player 2"), hjust=0.5) +
  theme_void()

if(length(payoffs$ul) == 3){
  g <- g + geom_text(aes(x=.4, y=.525, label=paste0("Tie: ", payoffs$ul[3])), hjust=0)

}
if(length(payoffs$lr) == 3){
  g <- g + geom_text(aes(x=.75, y=.125, label=paste0("Tie: ", payoffs$lr[3])), hjust=0)
}
if(length(payoffs$ll) == 3){
  g <- g + geom_text(aes(x=.4, y=.125, label=paste0("Tie: ", payoffs$ll[3])), hjust=0)
}
if(length(payoffs$ur) == 3){
  g <- g+geom_text(aes(x=.75, y=.525, label=paste0("Tie: ", payoffs$ur[3])), hjust=0)
}
g
}

pd_game(payoffs)
页面原文内容由Stack Overflow提供。腾讯云小微IT领域专用引擎提供翻译支持
原文链接:
https://stackoverflow.com/questions/71340299
复制相关文章
相似问题
腾讯云开发者

Copyright © 2013 - 2026 Tencent Cloud. All Rights Reserved. 腾讯云 版权所有
深圳市腾讯计算机系统有限公司 ICP备案/许可证号:粤B2-20090059 ![]() 粤公网安备44030502008569号
粤公网安备44030502008569号
腾讯云计算(北京)有限责任公司 京ICP证150476号 | 京ICP备11018762号