
极地图中使用Wedge()的Matplotlib
TL/博士:如何在极坐标中使用Wedge()?
我在极坐标(r,theta)中生成一个二维直方图图。在r的不同值下,可以有不同的θ值(以保持等面积大小的回收箱)。为了画出颜色编码的回收箱,我现在对每个径向环使用pcolormesh()调用。这是可行的,但在图的中心,可能只有3个垃圾箱(在θ空间中每个都是120度“宽”),pcolormesh()绘制的三角形不会“扫”出全弧(只将两个外弧点与一条直线连接起来)。
我已经找到了一个使用ax.bar()调用的解决方案,一个用于每个径向环,并传入θ值数组(每个bin呈现为一个单独的条)。但是,当做90个圈,每个3到360个泰塔垃圾箱,它是难以置信的慢(分钟)。
我尝试使用Wedge()修补程序,但无法让它们在极坐标投影中正确呈现。下面是展示这两种方法的示例代码:
import matplotlib.pyplot as plt
import numpy as np
from matplotlib.patches import Wedge
from matplotlib.collections import PatchCollection
# Theta coordinates in degrees
theta1=45
theta2=80
# Radius coordinates
r1 = 0.4
r2 = 0.5
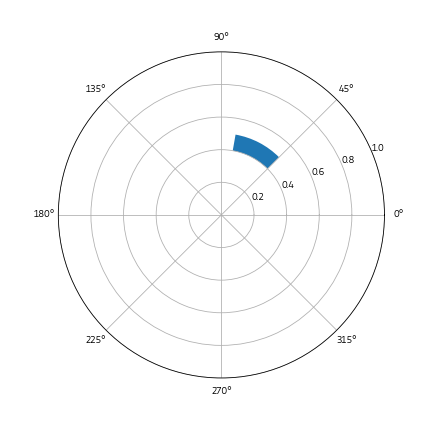
# Plot using bar()
fig, ax = plt.subplots(figsize=[6,6], subplot_kw={'projection': 'polar'})
theta_mid = np.deg2rad((theta1 + theta2)/2)
theta_width = np.deg2rad(theta2 - theta1)
height = r2 - r1
ax.bar(x=theta_mid, height = height, width=theta_width, bottom=r1)
ax.set_rlim(0, 1)
plt.savefig('bar.png')
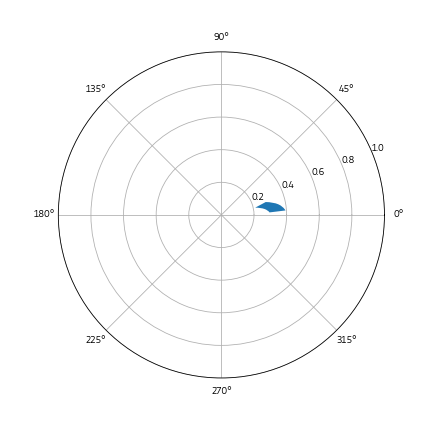
# Plot using Wedge()
fig, ax = plt.subplots(figsize=[6,6], subplot_kw={'projection': 'polar'})
patches = []
patches.append( Wedge(center=(0, 0), r = r1, theta1=theta1, theta2=theta2, width = r2-r1, color='blue'))
p = PatchCollection(patches)
ax.add_collection(p)
ax.set_rlim(0, 1)
plt.savefig('wedge.png')每项产出如下:
Bar
楔
我试着用弧度来表示楔形(因为极坐标通常希望它们的角度值是弧度)。这没什么用。
我在使用楔子的时候是不是遗漏了什么?如果我在我的修补程序集合中添加数千个楔形,如果我有任何期望的话,它会比bar()更快
回答 1
Stack Overflow用户
发布于 2022-03-30 09:18:41
考虑到这是一个实际的错误,我在matplotlib上打开了这个问题https://github.com/matplotlib/matplotlib/issues/22717,其中一位维护人员很好地指出,我应该使用Rectangle()而不是Wedge()。
他们提供的解决方案是
from matplotlib.patches import Rectangle

fig, ax = plt.subplots(figsize=[6,6], subplot_kw={'projection': 'polar'})
p = PatchCollection([Rectangle((np.deg2rad(theta1), r1), theta_width, height, color='blue')])
ax.add_collection(p)
ax.set_rlim(0, 1)
plt.savefig('wedge.png')https://stackoverflow.com/questions/71325569
复制相似问题
腾讯云开发者

Copyright © 2013 - 2026 Tencent Cloud. All Rights Reserved. 腾讯云 版权所有
深圳市腾讯计算机系统有限公司 ICP备案/许可证号:粤B2-20090059 ![]() 粤公网安备44030502008569号
粤公网安备44030502008569号
腾讯云计算(北京)有限责任公司 京ICP证150476号 | 京ICP备11018762号