
使用python的股票交易所所有股票的市值
使用python的股票交易所所有股票的市值
提问于 2022-02-27 01:33:45
我需要得到股票交易所(纽约证券交易所和纳斯达克)所有股票的当前市值,以及他们的其他信息,如关闭,开放等(但这些是可选的)。
有没有类似csv文件或api请求的方法可以给我提供这些信息?
我认为yfinance没有这个特性来返回所有股票的市值,对吗?
回答 3
Stack Overflow用户
发布于 2022-02-27 04:45:31
使用像金融建模准备这样的API。
import pandas as pd
import requests
FMP_key = 'YOUR API KEY HERE'
# Define lists of symbols and market caps
symbols = []
market_caps = []
# Define a function to get the url based on your API key and
def url(symbol: str, api_key):
return "https://financialmodelingprep.com/api/v3/market-capitalization/" + symbol + "?apikey=" + api_key
# All the symbols you want the data for
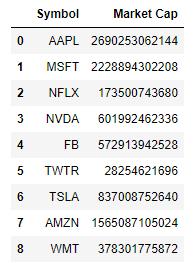
all_symbols = ['AAPL', 'MSFT', 'NFLX', 'NVDA', 'FB', 'TWTR', 'TSLA', 'AMZN', 'WMT']
# DataFrame to store all the data
data = pd.DataFrame(columns = ['Symbol', 'Market Cap'])
# Iterate based on the symbols list and add to DataFrame
for item in all_symbols:
response = requests.get(url(symbol = item, api_key = FMP_key)).json()
symbols.append(response[0]['symbol'])
market_caps.append(response[0]['marketCap'])
# Add data to the dataframe
data['Symbol'] = symbols
data['Market Cap'] = market_caps结果:
Stack Overflow用户
发布于 2022-06-17 02:42:07
下面的代码示例对您有用吗?如果没有,我有几个可选的示例脚本。
import requests
from bs4 import BeautifulSoup
from pandas import DataFrame
import itertools
import numpy as np
from itertools import chain

url_base = "https://finviz.com/quote.ashx?t="

tckr = ['MSFT','AAPL','AMZN']

i = 1

url_list = [(s, url_base + s) for s in tckr]
data_list = []

headers = {'User-Agent': 'Mozilla/5.0 (X11; Ubuntu; Linux x86_64; rv:76.0) Gecko/20100101 Firefox/76.0'}

for t, url in url_list:
    print(i)
    i = i + 1
    print(t, url)
    print('Scrapping ticker {}...'.format(t))
    soup = BeautifulSoup(requests.get(url, headers=headers).content, 'html.parser')
    #writer.writerow([t])
    l = []
    for row in soup.select('.snapshot-table2 tr'):
        l.append([td.text for td in row.select('td')])
        x = list(chain.from_iterable(l))
        d = dict(zip(x[::2], x[1::2]))
        d['Index'] = t

    data_list.append(d)
-结果:
Out[139]:
[{'Index': 'MSFT',
  'P/E': '25.56',
  'EPS (ttm)': '9.59',
  'Insider Own': '0.07%',
  'Shs Outstand': '7.49B',
  'Perf Week': '-7.49%',
  'Market Cap': '1917.59B',
  'Forward P/E': '22.80',
  'EPS next Y': '15.54%',
  'Insider Trans': '-0.56%',
  'Shs Float': '7.46B',
  'Perf Month': '-8.19%',
  'Income': '72.46B',
  'PEG': '1.59',
  'EPS next Q': '2.31',
  'Inst Own': '71.80%',
  'Short Float': '0.62%',
  'Perf Quarter': '-17.02%',
  'Sales': '192.56B',
  'P/S': '9.96',
  'EPS this Y': '39.70%',
  'Inst Trans': '-0.62%',
  'Short Ratio': '1.43',
  'Perf Half Y': '-26.80%',
  'Book/sh': '21.74',
  'P/B': '11.27',
  'ROA': '21.40%',
  'Target Price': '360.65',
  'Perf Year': '-6.11%',
  'Cash/sh': '13.37',
  'P/C': '18.32',
  'EPS next 5Y': '16.11%',
  'ROE': '47.00%',
  '52W Range': '241.51 - 349.67',
  'Perf YTD': '-27.16%',
  'Dividend': '2.48',
  'P/FCF': '41.75',
  'EPS past 5Y': '25.70%',
  'ROI': '28.20%',
  '52W High': '-29.94%',
  'Beta': '0.94',
  'Dividend %': '1.01%',
  'Quick Ratio': '1.90',
  'Sales past 5Y': '13.00%',
  'Gross Margin': '68.70%',
  '52W Low': '1.43%',
  'ATR': '8.55',
  'Employees': '181000',
  'Current Ratio': '2.00',
  'Sales Q/Q': '18.40%',
  'Oper. Margin': '42.50%',
  'RSI (14)': '36.90',
  'Volatility': '2.69% 2.85%',
  'Optionable': 'Yes',
  'Debt/Eq': '0.40',
  'EPS Q/Q': '9.10%',
  'Profit Margin': '37.60%',
  'Rel Volume': '1.03',
  'Prev Close': '251.76',
  'Shortable': 'Yes',
  'LT Debt/Eq': '0.38',
  'Earnings': 'Apr 26 AMC',
  'Payout': '24.50%',
  'Avg Volume': '32.16M',
  'Price': '244.97',
  'Recom': '1.70',
  'SMA20': '-6.47%',
  'SMA50': '-10.19%',
  'SMA200': '-18.62%',
  'Volume': '33,061,518',
  'Change': '-2.70%'},
 {'Index': 'AAPL',
  'P/E': '21.14',
  'EPS (ttm)': '6.15',
  'Insider Own': '0.07%',
  'Shs Outstand': '16.28B',
  'Perf Week': '-8.82%',
  'Market Cap': '2189.63B',
  'Forward P/E': '19.84',
  'EPS next Y': '6.83%',
  'Insider Trans': '-1.58%',
  'Shs Float': '16.17B',
  'Perf Month': '-12.85%',
  'Income': '101.94B',
  'PEG': '2.13',
  'EPS next Q': '1.16',
  'Inst Own': '59.70%',
  'Short Float': '0.70%',
  'Perf Quarter': '-19.03%',
  'Sales': '386.02B',
  'P/S': '5.67',
  'EPS this Y': '71.40%',
  'Inst Trans': '-0.43%',
  'Short Ratio': '1.19',
  'Perf Half Y': '-27.46%',
  'Book/sh': '4.14',
  'P/B': '31.42',
  'ROA': '28.90%',
  'Target Price': '188.92',
  'Perf Year': '-1.31%',
  'Cash/sh': '3.06',
  'P/C': '42.51',
  'EPS next 5Y': '9.91%',
  'ROE': '152.90%',
  '52W Range': '128.46 - 182.94',
  'Perf YTD': '-26.76%',
  'Dividend': '0.92',
  'P/FCF': '24.05',
  'EPS past 5Y': '22.00%',
  'ROI': '50.00%',
  '52W High': '-28.91%',
  'Beta': '1.20',
  'Dividend %': '0.71%',
  'Quick Ratio': '0.90',
  'Sales past 5Y': '11.10%',
  'Gross Margin': '43.30%',
  '52W Low': '1.24%',
  'ATR': '5.23',
  'Employees': '154000',
  'Current Ratio': '0.90',
  'Sales Q/Q': '8.60%',
  'Oper. Margin': '30.90%',
  'RSI (14)': '33.79',
  'Volatility': '2.78% 3.31%',
  'Optionable': 'Yes',
  'Debt/Eq': '1.78',
  'EPS Q/Q': '9.20%',
  'Profit Margin': '26.40%',
  'Rel Volume': '1.13',
  'Prev Close': '135.43',
  'Shortable': 'Yes',
  'LT Debt/Eq': '1.53',
  'Earnings': 'Apr 28 AMC',
  'Payout': '14.20%',
  'Avg Volume': '95.49M',
  'Price': '130.06',
  'Recom': '1.90',
  'SMA20': '-8.73%',
  'SMA50': '-15.20%',
  'SMA200': '-18.27%',
  'Volume': '107,659,951',
  'Change': '-3.97%'},
 {'Index': 'AMZN',
  'P/E': '50.13',
  'EPS (ttm)': '2.07',
  'Insider Own': '9.80%',
  'Shs Outstand': '10.18B',
  'Perf Week': '-10.75%',
  'Market Cap': '1117.20B',
  'Forward P/E': '38.52',
  'EPS next Y': '238.07%',
  'Insider Trans': '-0.00%',
  'Shs Float': '457.72M',
  'Perf Month': '-10.15%',
  'Income': '21.41B',
  'PEG': '1.24',
  'EPS next Q': '0.16',
  'Inst Own': '60.70%',
  'Short Float': '21.70%',
  'Perf Quarter': '-34.07%',
  'Sales': '477.75B',
  'P/S': '2.34',
  'EPS this Y': '54.90%',
  'Inst Trans': '0.20%',
  'Short Ratio': '1.15',
  'Perf Half Y': '-40.19%',
  'Book/sh': '13.16',
  'P/B': '7.88',
  'ROA': '5.40%',
  'Target Price': '178.13',
  'Perf Year': '-40.58%',
  'Cash/sh': '6.16',
  'P/C': '16.83',
  'EPS next 5Y': '40.50%',
  'ROE': '16.90%',
  '52W Range': '101.26 - 188.65',
  'Perf YTD': '-37.82%',
  'Dividend': '-',
  'P/FCF': '-',
  'EPS past 5Y': '67.60%',
  'ROI': '9.50%',
  '52W High': '-45.05%',
  'Beta': '1.24',
  'Dividend %': '-',
  'Quick Ratio': '0.70',
  'Sales past 5Y': '28.10%',
  'Gross Margin': '42.10%',
  '52W Low': '2.37%',
  'ATR': '5.57',
  'Employees': '1622000',
  'Current Ratio': '1.00',
  'Sales Q/Q': '7.30%',
  'Oper. Margin': '4.10%',
  'RSI (14)': '37.30',
  'Volatility': '4.17% 4.11%',
  'Optionable': 'Yes',
  'Debt/Eq': '0.53',
  'EPS Q/Q': '-147.80%',
  'Profit Margin': '4.50%',
  'Rel Volume': '0.95',
  'Prev Close': '107.67',
  'Shortable': 'Yes',
  'LT Debt/Eq': '0.51',
  'Earnings': 'Apr 28 AMC',
  'Payout': '0.00%',
  'Avg Volume': '86.54M',
  'Price': '103.66',
  'Recom': '1.70',
  'SMA20': '-8.46%',
  'SMA50': '-18.17%',
  'SMA200': '-33.06%',
  'Volume': '81,975,496',
'Change': '-3.72%'}]Stack Overflow用户
发布于 2022-08-28 13:01:51
我想你忽略了金融公司提供的信息。实际上是股票的市场资本,当然还有其他的细节。例如。
import yfinance as yf

msft = yf.Ticker("MSFT")
msft.info['marketCap']
Out[51]: 1999385657344
所以,你现在需要的是纽约证交所和纳斯达克所有股票的清单。我确实有一个代码来收集马来西亚的所有股票,以供研究之用,但我会在这里提供,也许你可以根据你自己的使用来修改它。
# Construction sectors' url
Construct_URL = "https://www.malaysiastock.biz/Listed-Companies.aspx?type=S&s1=3"

market_sectors = ['construction']
market_url = [Construct_URL]

import re
import yfinance as yf
import pandas as pd

# The info of the companies in a sector from the sector url
def info(url, output_fname="sector.csv"):
    dfs = pd.read_html(url, match="ROE")
    out = dfs[1]
    out.to_csv(f"{output_fname}.csv")

# Obtain the company names into a dataframe
def sector_companies(input_fname="sector"):
    dfs = pd.read_csv(f"{input_fname}.csv", header=0)
    return dfs["Company"]

def sto_data(start, end, close_fname):  ## Retrieving data from all stocks
    company_names = []
    stocks_data = []
    for company_str in company_list:
        temp = re.search(r"\(\w+", company_str)
        res = company_str[temp.start() : temp.end()]
        company_name = str(res).strip()[1:]
        stock_code = f"{company_name}.KL"
        company_names.append(company_name)
        stock_data = yf.download(stock_code, start=start, end=end)
        df = pd.DataFrame(stock_data)
        stocks_data.append(df)

    result = pd.concat(stocks_data, axis=1)
    result_columns = ["Open", "High", "Low", "Close", "Adj Close", "Volume"]
    headers = pd.MultiIndex.from_product([company_names, result_columns])
    result.to_csv(f"{close_fname}.csv", header=headers)


for i, j in zip(market_sectors, market_url):
    fname = i
    stocks_data_fname = f"{i}_stocks"
    start_date = "2021-01-01"
    end_date = "2021-12-31"
    url = j
    info(url, fname)
    company_list = sector_companies(fname)
sto_data(start_date, end_date, stocks_data_fname)页面原文内容由Stack Overflow提供。腾讯云小微IT领域专用引擎提供翻译支持
原文链接:
https://stackoverflow.com/questions/71281497
复制相关文章
相似问题
腾讯云开发者

Copyright © 2013 - 2026 Tencent Cloud. All Rights Reserved. 腾讯云 版权所有
深圳市腾讯计算机系统有限公司 ICP备案/许可证号:粤B2-20090059 ![]() 粤公网安备44030502008569号
粤公网安备44030502008569号
腾讯云计算(北京)有限责任公司 京ICP证150476号 | 京ICP备11018762号