
如何对python中的x轴标签和传说进行排序?
如何对python中的x轴标签和传说进行排序?
提问于 2022-02-09 20:41:25
排序X轴标签
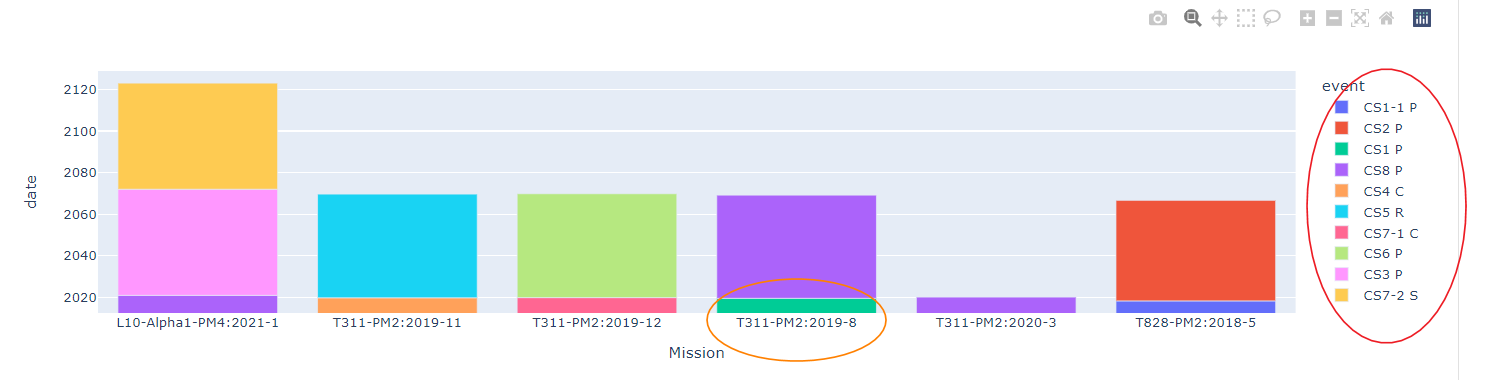
我有一个python包含的字典列表,我正在整理和排序使用熊猫数据在宽形式。我希望在图形中看到的是,x轴标签将按年份和周期进行分组和排序。这里的周期可能在1-52之间。但我看到的是其中一个组没有被分类(或者没有完全排序)。我试着更新categoryorder 文档。似乎不像我预料的那样起作用了。这是我希望看到的x轴标签上的一个组的顺序:
T311-PM2:2019-8, T311-PM2:2019-11, T311-PM2:2019-12, T311-PM2:2020-3.排序传说
传说中也有类似的行为。我尝试使用legend_traceorder 文档进行排序。
我希望看到这样的订单:
CS1 P, CS1-1 P, CS2 P, CS3 P, CS4 C, CS5 R, CS6 P, CS7-1 C, CS7-2 S, CS8 P这是我将在代码中使用的dict数据:
response_dict = {
    "data": [
        {
            "machineType": "L10-Alpha1-PM4",
            "date": "2021-1",
            "event": "CS3 P",
            "mins": "0.00"
        },
        {
            "machineType": "L10-Alpha1-PM4",
            "date": "2021-1",
            "event": "CS7-2 S",
            "mins": "7.14"
        },
        {
            "machineType": "L10-Alpha1-PM4",
            "date": "2021-1",
            "event": "CS8 P",
            "mins": "4.17"
        },
        {
            "machineType": "T311-PM2",
            "date": "2019-8",
            "event": "CS1 P",
            "mins": "21.14"
        },
        {
            "machineType": "T311-PM2",
            "date": "2019-11",
            "event": "CS4 C",
            "mins": "2.92"
        },
        {
            "machineType": "T311-PM2",
            "date": "2019-11",
            "event": "CS5 R",
            "mins": "327.88"
        },
        {
            "machineType": "T311-PM2",
            "date": "2019-12",
            "event": "CS7-1 C",
            "mins": "43.90"
        },
        {
            "machineType": "T311-PM2",
            "date": "2019-12",
            "event": "CS6 P",
            "mins": "2147.27"
        },
        {
            "machineType": "T311-PM2",
            "date": "2019-8",
            "event": "CS8 P",
            "mins": "0.10"
        },
        {
            "machineType": "T311-PM2",
            "date": "2020-3",
            "event": "CS8 P",
            "mins": "19.31"
        },
        {
            "machineType": "T828-PM2",
            "date": "2018-5",
            "event": "CS1-1 P",
            "mins": "11.43"
        },
        {
            "machineType": "T828-PM2",
            "date": "2018-5",
            "event": "CS2 P",
            "mins": "10.83"
        }
    ]
}
我的代码
import pandas as pd
import plotly.express as px

df_normalized = pd.json_normalize(response_dict['data'])
df_normalized['Mission'] = df_normalized[['machineType', 'date']].agg(':'.join, axis=1)
df_normalized[['year', 'period']] = df_normalized['date'].str.split('-', expand=True).astype(int)
data_frame = df_normalized.sort_values(by=['year', 'period'])
figure = px.bar(data_frame, x='Mission', y='date', color='event').update_xaxes(categoryorder='category ascending')#.update_layout(legend_traceorder='normal')
figure.show()
图
回答 1
Stack Overflow用户
发布于 2022-06-09 08:06:08
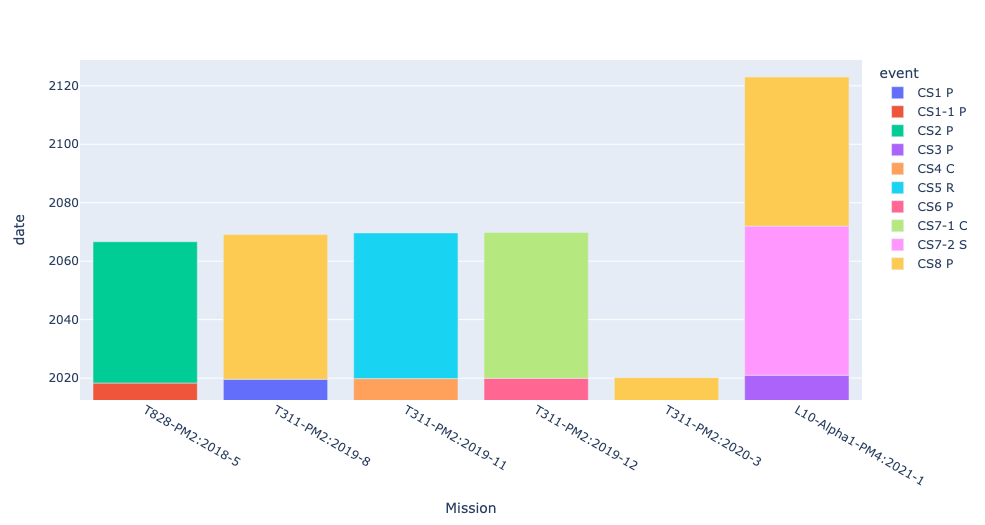
您的方向是正确的,只需要使用category_orders而不是categoryorder,并使用sorted()方法定义数据的顺序。
df_normalized = pd.json_normalize(response_dict['data'])
df_normalized['Mission'] = df_normalized[['machineType', 'date']].agg(':'.join, axis=1)
df_normalized[['year', 'period']] = df_normalized['date'].str.split('-', expand=True).astype(int)
data_frame = df_normalized.sort_values(by=['year', 'period']).reset_index(drop=True)
figure = px.bar(data_frame, x='Mission',y='date', color='event',\
                category_orders={'event':sorted(data_frame.event.unique()),\
                                 'Mission':sorted(data_frame.Mission,\
                                                  key = lambda x: pd.to_datetime(x.split(':')[1]))})
figure.show()P.S:我通常在.reset_index(drop=True)上使用.sort_values()之后的DataFrame,以保持索引值的正确顺序。
页面原文内容由Stack Overflow提供。腾讯云小微IT领域专用引擎提供翻译支持
原文链接:
https://stackoverflow.com/questions/71056432
复制相关文章
相似问题
腾讯云开发者

Copyright © 2013 - 2026 Tencent Cloud. All Rights Reserved. 腾讯云 版权所有
深圳市腾讯计算机系统有限公司 ICP备案/许可证号:粤B2-20090059 ![]() 粤公网安备44030502008569号
粤公网安备44030502008569号
腾讯云计算(北京)有限责任公司 京ICP证150476号 | 京ICP备11018762号