
ggspatial: geom_sf在coord_sf中使用某些xlim值失败
我要做的是:用ggspatial::geom_sf()绘制空间对象,使用coord_sf()或ggspatial::layer_spatial()和ggspatial::annotation_spatial()的组合来指定地块的范围。
这种ggplot/ggplot行为已经在几个帖子中描述过,但是“解决方案”只是一些临时的黑客,它们不能保证问题不会再次发生。见:Setting limits for x and y using coord_sf after updating ggplot2 Error when plotting latitude and longitude points on US map in RStudio
这段代码工作得很好:
require(sf); require(ggspatial); require(rnaturalearth)
country_polygons <- st_as_sf(ne_countries())
ggplot() + geom_sf(data=country_polygons)
这一点也是如此:
ggplot() + geom_sf(data=country_polygons) + coord_sf(xlim=c(-100,100), ylim=c(-60,60))但是:
ggplot() + geom_sf(data=country_polygons) + coord_sf(xlim=c(-160,150), ylim=c(-60,60))错误的结果:st_cast.POINT中的错误(X[i],.):无法从点创建多个
显然,这种情况不应该发生。我不明白为什么geom_sf调用st_cast.POINT(),因为输入中不应该有任何点。我尝试了三种不同的世界地图( GADM 3.6 shapefile,rworldmap:countriesLow和rnaturalearth 1),所以它似乎并不是特定于数据集的。
使用这些x和y限制值,甚至一个简单的sf点对象也无法绘制!
set.seed(80085)
tibble(Lon=runif(1000,-180,180),
       Lat=runif(1000,-90,90)) %>%
  st_as_sf(coords=1:2, remove=F, crs=4326) -> random_points

random_points %>%
      ggplot() + geom_sf() + coord_sf(xlim=c(-160,150), ylim=c(-60,60))
错误消息再次是“不能从点创建MULTILINESTRING”,我不知道为什么它会尝试创建一个MULTILINESTRING。
更新:这里建议的解决方案不起作用:Why do some xlims and ylims produce this error in ggplot and sf?
random_points %>%
  st_crop(xmin=-160, xmax=150, ymin=-60, ymax=60) %>%
  ggplot() + geom_sf()
结果,奇怪的是,仅在150°E至160°W之间的点,即180°经度附近的太平洋上空,才被保存下来。我试着用经度从0到360,交换xmin和xmax,但没有结果。
撇开st_crop的错误行为不谈,传递一个正确的裁剪对象会再次产生相同的错误:
random_points %>%
  filter(Lon<150, Lon>-160, Lat>-60, Lat<60) %>%
  ggplot() + geom_sf()

> Error in st_cast.POINT(x[[1]], to, ...) :
  cannot create MULTILINESTRING from POINT
In addition: Warning message:
In st_cast.GEOMETRYCOLLECTION(X[[i]], ...) :
  only first part of geometrycollection is retained
结束更新
有解决办法或解决办法吗?
回答 1
Stack Overflow用户
发布于 2022-02-09 11:54:52
我相信这与s2几何引擎以一种意想不到的方式运行有关。
TL;DR:考虑在代码中使用sf_use_s2(F)。
长篇版本:
library(sf)
library(dplyr)
library(mapview)
set.seed(80085)
random_points <- tibble(Lon = runif(1000,-180,180),
Lat = runif(1000,-90,90)) %>%
st_as_sf(coords=1:2, remove=F, crs=4326)
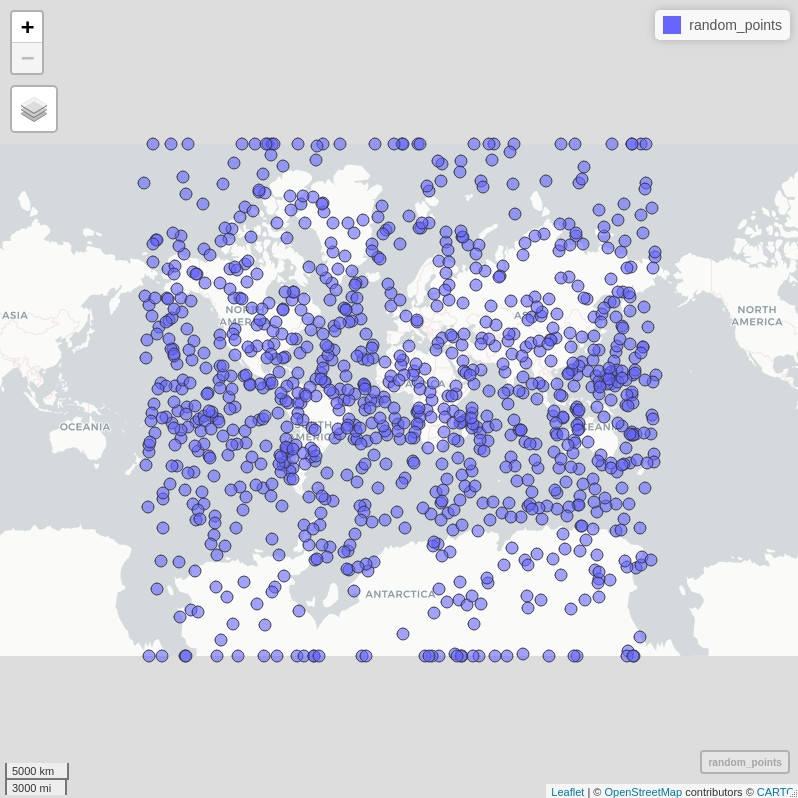
mapview(random_points) # this is "truth"
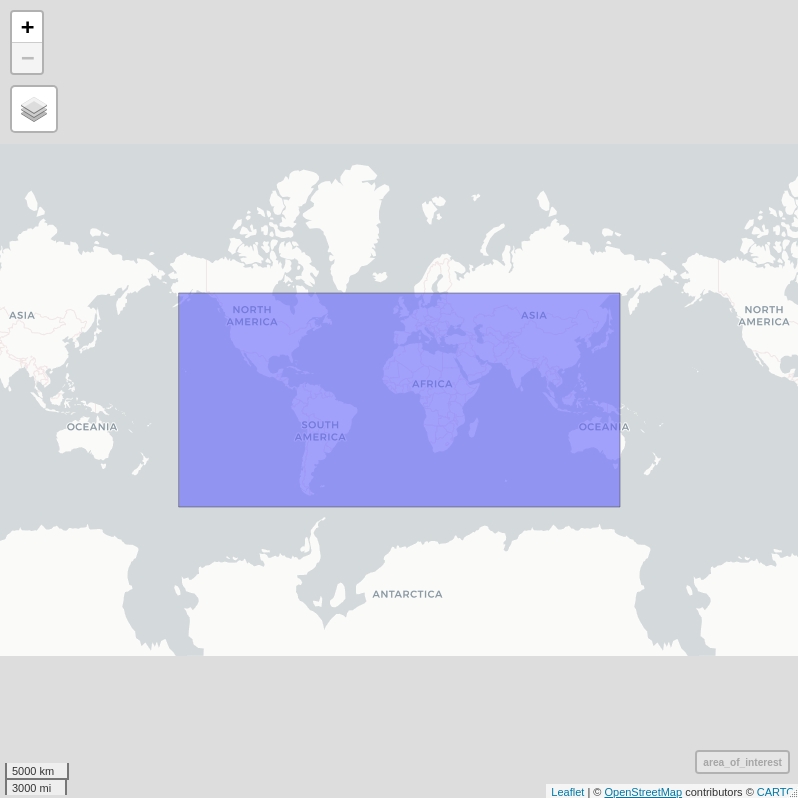
area_of_interest <- matrix(c(-160, -60,
                             150, -60,
                             150, 60,
                             -160, 60,
                             -160, -60),
                           byrow = TRUE,
                           ncol = 2) %>%
  list() %>%
  st_polygon() %>%
  st_sfc(crs = 4326)

mapview(area_of_interest) # this is our area of interest
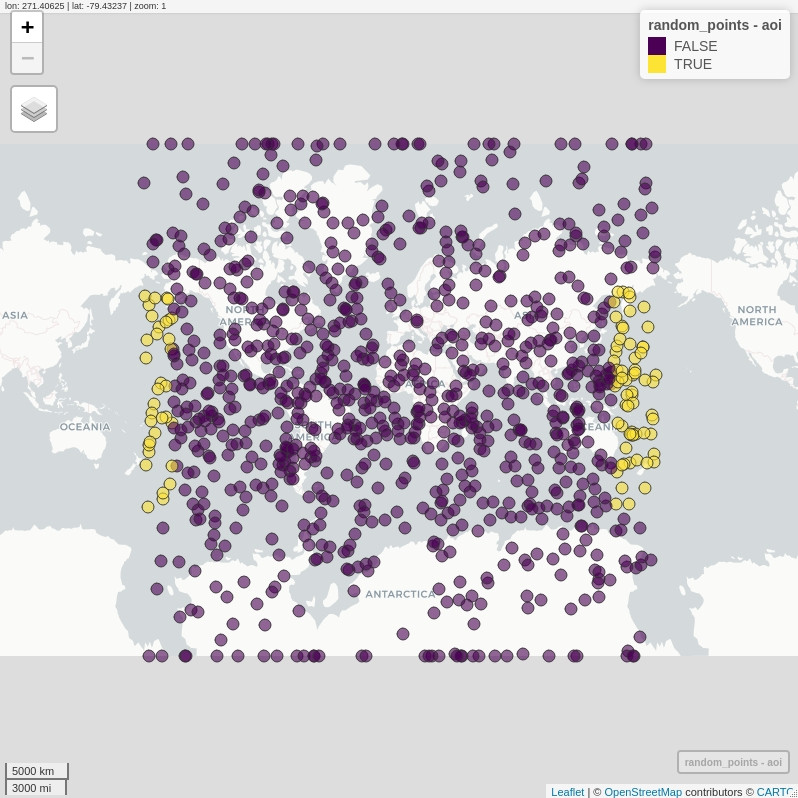
# an atribute of points - in AOI or not?
random_points$aoi <- st_contains(area_of_interest,
                                 random_points,
                                 sparse = F) %>%
  t() %>%
  c()

# a visual overview; this is _not_ expected!
# the topology of AOI was not applied correctly
mapview(random_points, zcol = "aoi")
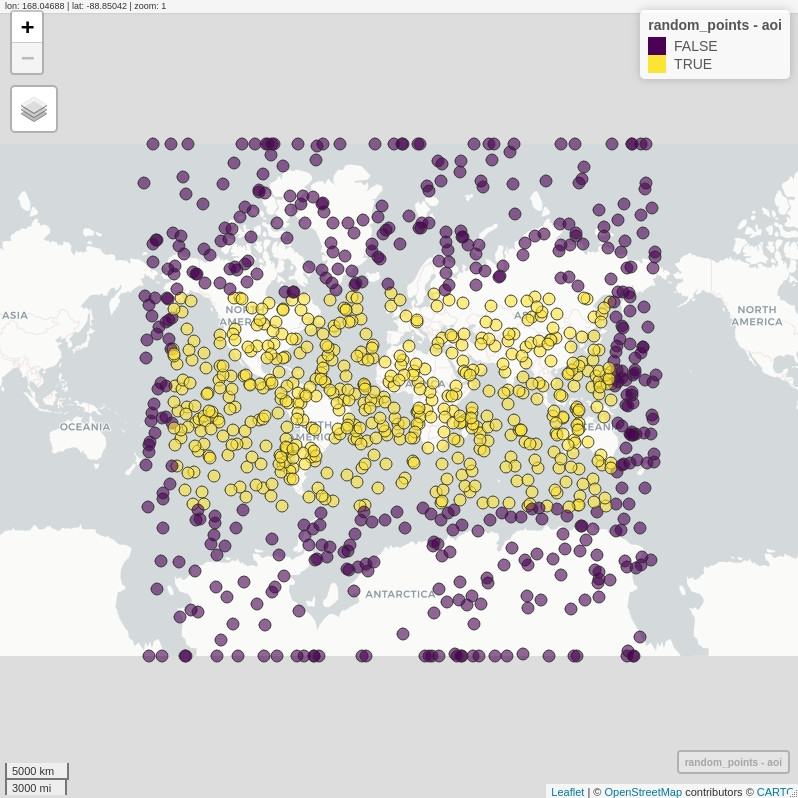
# let us try turning S2 engine off, and fall back to good old GEOS
sf_use_s2(F)

# exactly the same code as before!!
random_points$aoi <- st_contains(area_of_interest,
                                 random_points,
                                 sparse = F) %>%
  t() %>%
  c()

# but the output behaves much better!
mapview(random_points, zcol = "aoi")
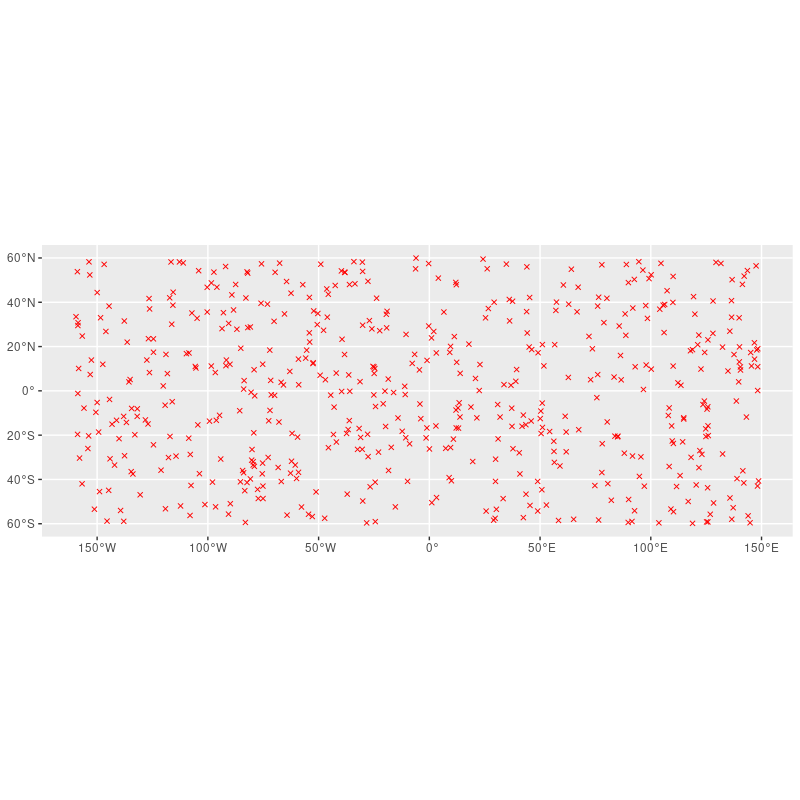
# a seletion of random points; cropped to area of interest
library(ggplot2)

random_points %>%
  filter(aoi) %>%
  ggplot() + geom_sf(pch = 4, color = "red")
https://stackoverflow.com/questions/71037912
复制相似问题
腾讯云开发者

Copyright © 2013 - 2026 Tencent Cloud. All Rights Reserved. 腾讯云 版权所有
深圳市腾讯计算机系统有限公司 ICP备案/许可证号:粤B2-20090059 ![]() 粤公网安备44030502008569号
粤公网安备44030502008569号
腾讯云计算(北京)有限责任公司 京ICP证150476号 | 京ICP备11018762号