
将三维图形数据转换为基于其中一列的颜色区分的条形图。
将三维图形数据转换为基于其中一列的颜色区分的条形图。
提问于 2022-02-04 02:24:12
我的原始数据如下所示:
CREATION TIME   Type
3-2 21:00       0
3-2 21:00       0
3-2 22:00       0
4-2 21:00       0
3-2 21:00       1
3-2 22:00       1
4-2 22:00       1
3-2 21:00       2
4-2 22:00       2
4-2 22:00       2
虽然这是我所拥有的结果分组数据
Type    Day    Hour
0       3    21    2
             22    1
        4    21    1
1       3    21    1
             22    1
        4    22    1
2       3    21    1
        4    22    2
想象一下这会敲我的前门,后门和侧门。其中0是前面,1是后门,2是侧门。它向我展示了每天和每小时敲门的次数。它总是在右边显示和。
我希望这些数据现在显示在条形图中,其中来自同一天和同一时间的数据相互叠加,只是根据它们的类型有不同的颜色。

这代表了我要找的东西。我在玩matplotlib,但我似乎做不到。希望有人能帮忙
编辑:这里是我的群代码
time_data_station1 = df.groupby([df["Type"], df["CREATION TIME"].dt.day, df["CREATION TIME"].dt.hour]).size()回答 2
Stack Overflow用户
发布于 2022-02-04 04:43:07
好吧这就是我所做的
import pandas as pd
import seaborn as sns
import matplotlib.pyplot as plt
import numpy as np

df = pd.DataFrame({"Day":[3,3,3,4,4,4], "Hour":[21,21,22,21,21,22], "Type":[0,1,0,0,1,0], "Amount":[2,1,3,5,2,2]})

first = df[df["Type"] == 0].sort_values(["Day", "Hour"])
first.reset_index(inplace=True, drop=True)
second = df[df["Type"] == 1].sort_values(["Day", "Hour"])
second.reset_index(inplace=True, drop=True)
#third = df[df["Type"] == 2].sort_values(by=["Day", "Hour"])
#third.reset_index(inplace=True, drop=True)
#fourth = df[df["Type"] == 3].sort_values(by=["Day", "Hour"])
#fourth.reset_index(inplace=True, drop=True)
total = df.groupby(["Day","Hour"]).sum()
total.reset_index(inplace=True)

for i in [first,second]: # [first,second,third,fourth] modify this to increase the number of stacked elements
    ax = sns.barplot(x=total.index, y=total["Amount"], color="#09b0a8", alpha=0.3) #alpha makes color stacking easier
    for j in i.values:
        for num, val in enumerate(total.values):
            if val[0] == j[0] and val[1] == j[1]:
                total["Amount"].loc[num] = total["Amount"].loc[num] - j[3] #calculate height differential

plt.show()
这是一种非常手工的方法来解决这个问题。这里肯定有个图书馆。
Stack Overflow用户
发布于 2022-02-04 04:58:08
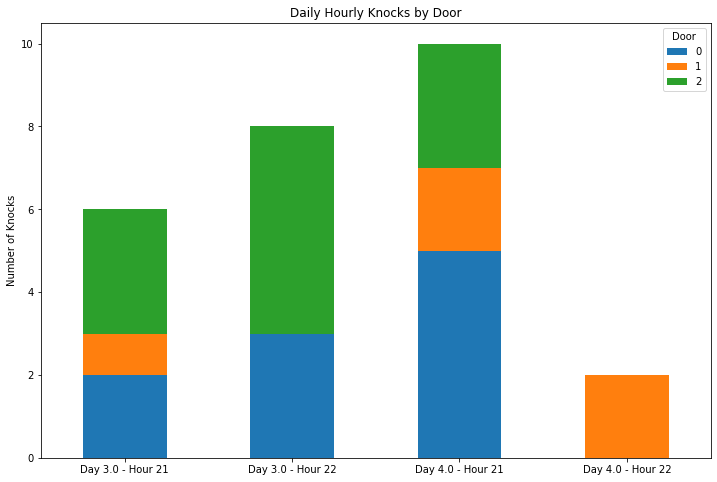
IIUC,
df = pd.DataFrame({'knocks':[2,3,5,1,2,2,3,5,3]},
                 index=pd.MultiIndex.from_arrays([[0,0,0,1,1,1,2,2,2],
                                                  [3.,3.,4.,3.,4.,4.,3.,3.,4.],
                                                  [21,22,21,21,21,22,21,22,21]]))


dfu=df.unstack(0)['knocks']
dfu.index = [f'Day {i} - Hour {j}' for i, j in dfu.index]

ax  = dfu.plot.bar(stacked=True, figsize=(12,8), rot=0)
ax.legend(title='Door');
ax.set_ylabel('Number of Knocks');
ax.set_title('Daily Hourly Knocks by Door');
输出:
页面原文内容由Stack Overflow提供。腾讯云小微IT领域专用引擎提供翻译支持
原文链接:
https://stackoverflow.com/questions/70980745
复制相关文章
相似问题
腾讯云开发者

Copyright © 2013 - 2026 Tencent Cloud. All Rights Reserved. 腾讯云 版权所有
深圳市腾讯计算机系统有限公司 ICP备案/许可证号:粤B2-20090059 ![]() 粤公网安备44030502008569号
粤公网安备44030502008569号
腾讯云计算(北京)有限责任公司 京ICP证150476号 | 京ICP备11018762号