
是否有一种方法可以将来自同一数据集的不同子组的框图混合起来?
是否有一种方法可以将来自同一数据集的不同子组的框图混合起来?
提问于 2022-02-02 16:02:23
我有这个数据
A <- c(100,101,102,98,97,93,96)
B <- c("John","Anne","John", "Anne","John","Anne","John")
C <- c("cheap", "cheap", "expensive", "cheap", "expensive", "cheap", "expensive")
D <- c("USA", "Mexico", "Mexico","USA", "Mexico","USA", "Mexico")

dataframe <- data.frame(A, B, C, D)

   A    B         C      D
1 100 John     cheap    USA
2 101 Anne     cheap Mexico
3 102 John expensive Mexico
4  98 Anne     cheap    USA
5  97 John expensive Mexico
6  93 Anne     cheap    USA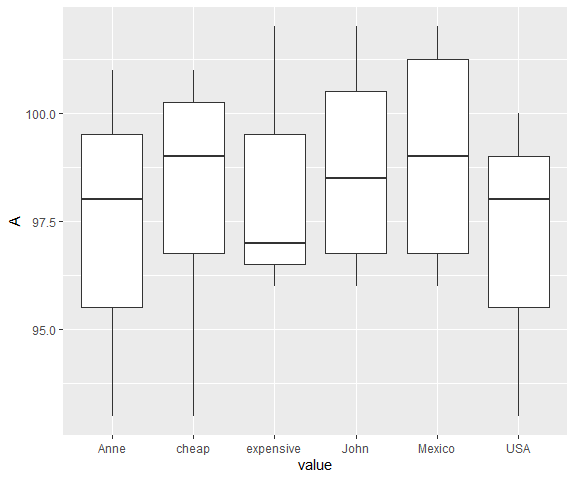
7 96 John expensive Mexico假设我想在相同的图上创建不同的盒子图,分组B、C和D列。
因此,总共有6个剧集(约翰、安妮、廉价、昂贵、美国和墨西哥)。当然,考虑到A组的值。
这里的问题是,每个子组都有不同的样本来绘制,这让我非常困惑。
回答 1
Stack Overflow用户
回答已采纳
发布于 2022-02-02 16:15:48
这个问题是reshaping the data to long format的问题。然后它就成了标准的盒子。
library(ggplot2)
library(magrittr)
library(tidyr)

dataframe %>%
  pivot_longer(-A) %>%
  ggplot(aes(value, A)) +
  geom_boxplot()
页面原文内容由Stack Overflow提供。腾讯云小微IT领域专用引擎提供翻译支持
原文链接:
https://stackoverflow.com/questions/70958840
复制相关文章
相似问题
腾讯云开发者

Copyright © 2013 - 2026 Tencent Cloud. All Rights Reserved. 腾讯云 版权所有
深圳市腾讯计算机系统有限公司 ICP备案/许可证号:粤B2-20090059 ![]() 粤公网安备44030502008569号
粤公网安备44030502008569号
腾讯云计算(北京)有限责任公司 京ICP证150476号 | 京ICP备11018762号