
熊猫数据图中的相似词集
熊猫数据图中的相似词集
提问于 2022-02-01 14:08:49
我有一个大的dataframe,这里有一个小子集:
key_words  prove      have      read   represent  lead   replace
be         0.58       0.49      0.48     0.17     0.23   0.89
represent  0.66       0.43      0        1        0      0.46
associate  0.88       0.23      0.12     0.43     0.11   0.67
induce 0.43 0.41 0.33 0.47 0 0.43 它显示了来自key_words的每个单词与其余列的距离有多近(根据它们的嵌入距离)。
我想要找到一种方法来可视化这个数据,这样我就可以看到在彼此最接近的单词之间形成的集群。
考虑到key_word列有字符串值,是否有一种简单的方法来做到这一点?
回答 1
Stack Overflow用户
发布于 2022-02-01 14:18:52
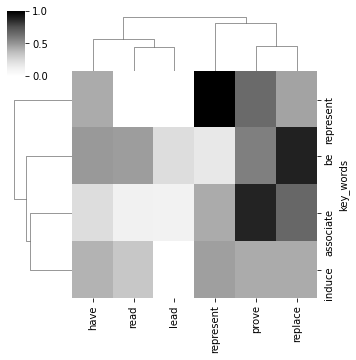
一种选择是将key_words列设置为索引,并使用seaborn.clustermap绘制集群:
# pip install seaborn
import seaborn as sns

sns.clustermap(df.set_index('key_words'),  # data
               vmin=0, vmax=1,    # values of min/max here white/black
               cmap='Greys',      # color palette
               figsize=(5,5)      # plot size
               )
产出:
页面原文内容由Stack Overflow提供。腾讯云小微IT领域专用引擎提供翻译支持
原文链接:
https://stackoverflow.com/questions/70941960
复制相关文章
相似问题
腾讯云开发者

Copyright © 2013 - 2026 Tencent Cloud. All Rights Reserved. 腾讯云 版权所有
深圳市腾讯计算机系统有限公司 ICP备案/许可证号:粤B2-20090059 ![]() 粤公网安备44030502008569号
粤公网安备44030502008569号
腾讯云计算(北京)有限责任公司 京ICP证150476号 | 京ICP备11018762号