
如何获得每一行最近的前一个值?
如何获得每一行最近的前一个值?
提问于 2022-01-29 18:21:38
我有一个DataFrame,它有很多股票(在这种情况下只有通用和F),销售增长,股票增长。
import pandas as pd
import numpy as np

d = {'year': [2000, 2000, 2001, 2001, 2002, 2002, 2003, 2003, 2004, 2004],  'Stock': ["GM", "F", "GM", "F", "GM", "F", "GM", "F", "GM", "F"], 'US Sales Growth': [.3, .3, .1, .1, .6, .6, .12, .12, .7, .7], 'Stock Growth': [.1, .2, .3, .4, .14, .16,  .2, .1,.15,.16]}

df = pd.DataFrame(data=d)
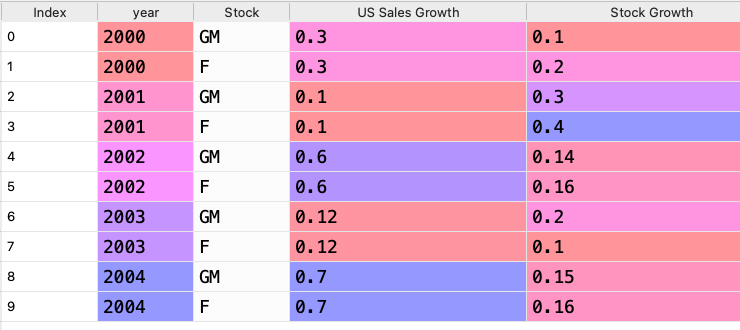
我的目标是添加一个名为"closets_sales_growth_corresponding_stock_growth“的列,它将当前的销售增长与过去的销售增长相匹配,并收集与最近的销售增长相对应的股票增长到新的列。
它应该是这样的:
回答 3
Stack Overflow用户
回答已采纳
发布于 2022-01-29 21:38:32
这里有一种使用groupby的方法。基本上,只要groupby“股票”,并适用于每一组的函数,以寻找股票增长最接近过去的美国销售增长的每一行。
def get_new_col(g):
    out = [np.nan]
    for idx in g.index[1:]:
        # get the index of the previous sales growth closest in absolute value to the current one
        closest_val_idx = (g.loc[idx, 'US Sales Growth'] - g.loc[:idx-1, 'US Sales Growth']).abs().idxmin()
        # index the stock growth with the index found above
        out.append(g.loc[closest_val_idx, 'Stock Growth'])
    return pd.Series(out, index=g.index)

df['growth_corresponding_stock_growth'] = df.groupby('Stock').apply(get_new_col).droplevel(0)
输出:
   year Stock  US Sales Growth  Stock Growth  growth_corresponding_stock_growth
0  2000    GM             0.30          0.10                             NaN
1  2000     F             0.30          0.20                             NaN
2  2001    GM             0.10          0.30                            0.10
3  2001     F             0.10          0.40                            0.20
4  2002    GM             0.60          0.14                            0.10
5  2002     F             0.60          0.16                            0.20
6  2003    GM             0.12          0.20                            0.30
7  2003     F             0.12          0.10                            0.40
8  2004    GM             0.70          0.15                            0.14
9 2004 F 0.70 0.16 0.16Stack Overflow用户
发布于 2022-01-29 18:58:54
我将创建一个函数,返回每一行的股票增长。然后,可以将其应用于每一行:
import pandas as pd
import numpy as np
# Create dataframe
d = {'year': [2000, 2000, 2001, 2001, 2002, 2002, 2003, 2003, 2004, 2004], 'Stock': ["GM", "F", "GM", "F", "GM", "F", "GM", "F", "GM", "F"], 'US Sales Growth': [.3, .3, .1, .1, .6, .6, .12, .12, .7, .7], 'Stock Growth': [.1, .2, .3, .4, .14, .16, .2, .1,.15,.16]}
df = pd.DataFrame(data=d)
# Define function to find nearest value
def find_nearest_value(df, year, stock, sales_growth):
# Filter df to only include rows of same stock and earlier year
filtered_df = df[(df['year'] < year) & (df['Stock'] == stock)]
# Order the filtered row by how close they are to current sales growth
ordered = (filtered_df['US Sales Growth']-sales_growth).abs().argsort()
# Return nan if we do not find any previous value
if len(ordered) == 0:
return np.nan
stock_growth = filtered_df['Stock Growth'].iloc[(ordered[:1])].values[0]
return stock_growth
# Apply function on each row
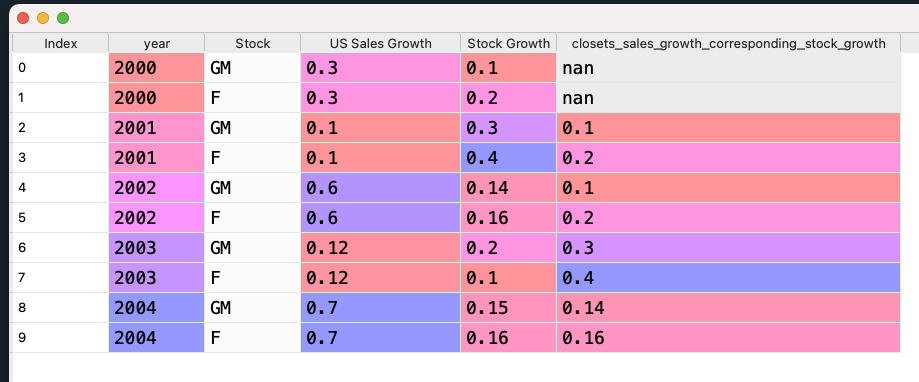
df['closets_sales_growth_corresponding_stock_growth'] = df.apply(lambda x: find_nearest_value(df, x['year'], x['Stock'], x['US Sales Growth']), axis=1)
df输出:
year    Stock   US Sales Growth Stock Growth    closets_sales_growth_corresponding_stock_growth
0   2000    GM  0.30    0.10    NaN
1   2000    F   0.30    0.20    NaN
2   2001    GM  0.10    0.30    0.10
3   2001    F   0.10    0.40    0.20
4   2002    GM  0.60    0.14    0.10
5   2002    F   0.60    0.16    0.20
6   2003    GM  0.12    0.20    0.30
7   2003    F   0.12    0.10    0.40
8   2004    GM  0.70    0.15    0.14
9 2004 F 0.70 0.16 0.16Stack Overflow用户
发布于 2022-01-29 18:56:56
不是很漂亮,但很管用:)
import pandas as pd
import numpy as np

d = {'year': [2000, 2000, 2001, 2001, 2002, 2002, 2003, 2003, 2004, 2004],  'Stock': ["GM", "F", "GM", "F", "GM", "F", "GM", "F", "GM", "F"], 'US Sales Growth': [.3, .3, .1, .1, .6, .6, .12, .12, .7, .7], 'Stock Growth': [.1, .2, .3, .4, .14, .16,  .2, .1,.15,.16]}

df = pd.DataFrame(data=d)

close_s_g_s = []

for i in df.index:
    stock = df['Stock'][i]
    cur_s_g = df['US Sales Growth'][i]

    stock_growth = np.nan
    min_s_g_dif = np.inf
    for i_less in range(0,i):

        if df['Stock'][i_less] == stock:
            s_g_dif = abs(df['US Sales Growth'][i_less] -  cur_s_g)
            if s_g_dif < min_s_g_dif:
                min_s_g_dif = s_g_dif
                stock_growth = df["Stock Growth"][i_less]

    close_s_g_s.append(stock_growth)

new_col = "closets_sales_growth_corresponding_stock_growth"
df[new_col] = close_s_g_s页面原文内容由Stack Overflow提供。腾讯云小微IT领域专用引擎提供翻译支持
原文链接:
https://stackoverflow.com/questions/70908426
复制相关文章
相似问题
腾讯云开发者

Copyright © 2013 - 2026 Tencent Cloud. All Rights Reserved. 腾讯云 版权所有
深圳市腾讯计算机系统有限公司 ICP备案/许可证号:粤B2-20090059 ![]() 粤公网安备44030502008569号
粤公网安备44030502008569号
腾讯云计算(北京)有限责任公司 京ICP证150476号 | 京ICP备11018762号