
X轴上有日期的r图
X轴上有日期的r图
提问于 2022-01-28 18:26:35
我试图在一张图上绘制海龟筑巢和孵化的季节性图--统计每一季(01/05/2021-30/09/2021)每一天产卵/孵化的数量。我的一些数据如下:
青枣绿
14/05/2021-0
15/05/2021-0
16/05/2021-0
17/05/2021-0
18/05/2021-0
19/05/2021-0
2021 -1 -0
21/05/2021- 2-0
22/05/2021-0
23/05/2021- 1-0
24/05/2021-2-0
25/05/2021-0
26/05/2021 -1 -0
27/05/2021 -4-0
然后尝试用ggplot绘制它时,使用:
ggplot(seasonality,aes(x=Date,y=seasonality$Laid Green))+geom_bar(stat="identity",width=1)我明白了:
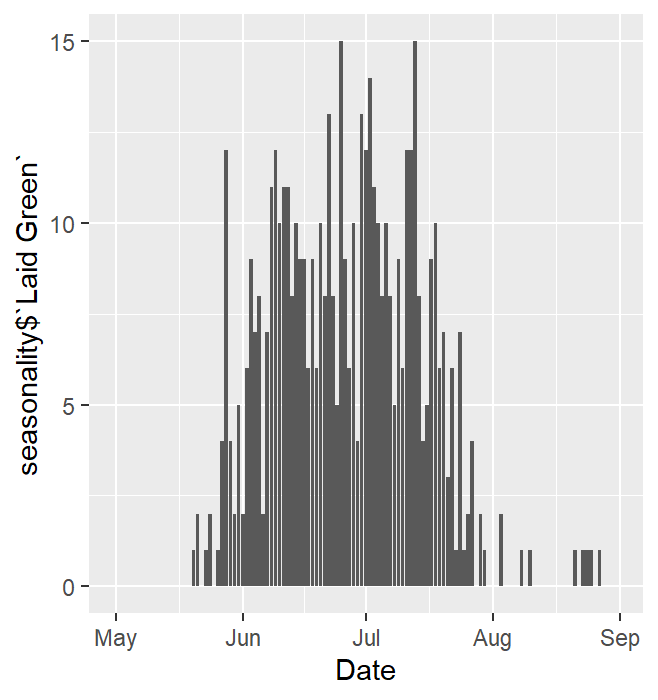
我想集中我的数据,以便这是视觉上更令人愉快,也许在5天?但我不知道该怎么做。我也试图绘制绿色孵化在同一图形与嵌套和孵化在2种不同的颜色。
任何帮助都是非常感谢的!
回答 1
Stack Overflow用户
发布于 2022-01-28 19:05:44
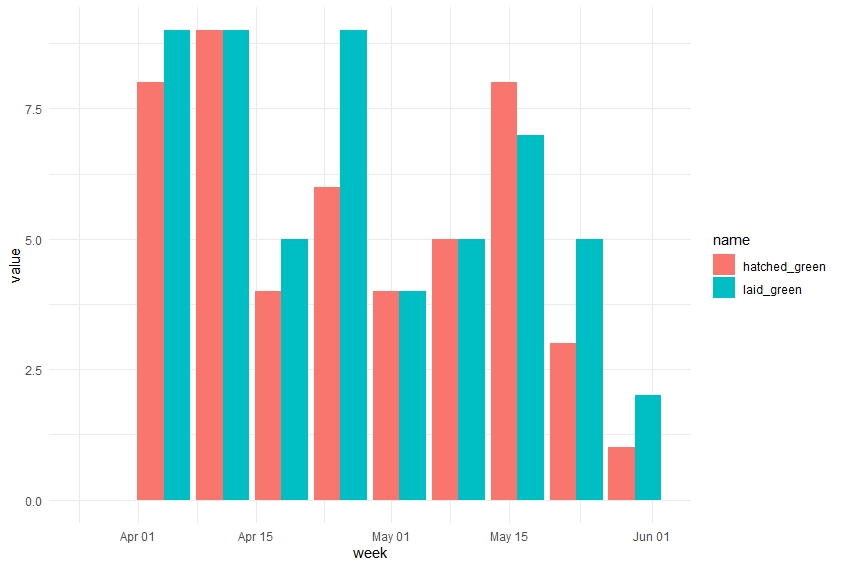
您可以使用该包润滑油将日期轮至一周开始。来自tidyverse的dplyr可以帮助你将计数相加。
library(lubridate)
library(tidyverse)

# so our random dataframes look the same
set.seed(123)

# fake data
seasonality <- tibble(date = sample(seq(as.Date('2021-04-01'), as.Date('2021-06-01'), by="day"),
                                    size = 100,
                                    replace = TRUE),
                      laid_green = sample(c(0:1),
                                          size = 100,
                                          replace = TRUE),
                      hatched_green = sample(c(0:1),
                                             size = 100,
                                             replace = TRUE)
                      ) %>%
  arrange(date)

# plot
seasonality %>%
  mutate(week = floor_date(date,
             unit = 'week')
  ) %>%
  group_by(week) %>%
  summarise(laid_green = sum(laid_green),
            hatched_green = sum(hatched_green)) %>%
  pivot_longer(-week) %>%
  ggplot(aes(x=week,y=value, fill = name)) +
  geom_col(pos = 'dodge')
页面原文内容由Stack Overflow提供。腾讯云小微IT领域专用引擎提供翻译支持
原文链接:
https://stackoverflow.com/questions/70898550
复制相关文章
相似问题
腾讯云开发者

Copyright © 2013 - 2026 Tencent Cloud. All Rights Reserved. 腾讯云 版权所有
深圳市腾讯计算机系统有限公司 ICP备案/许可证号:粤B2-20090059 ![]() 粤公网安备44030502008569号
粤公网安备44030502008569号
腾讯云计算(北京)有限责任公司 京ICP证150476号 | 京ICP备11018762号