
显示平均值的正负标准误差。
我试图用我的数据来表示一个点图,包括所有的点和平均值(SEM)的平均+/-标准误差。我建立了一个新的数据框架,称为“描述性”,它的值为平均值和扫描电镜,我设法将点和平均值表示出来,而不是用误差条表示SEM。有人能帮我为剧本提供一些建议或建议吗?我给你一个虹膜数据的例子。
library(ggplot2)
library(dplyr)
iris<- iris
SEM <- function(x){sd(x)/sqrt(length(x))}
iris %>%
group_by(Species) %>%
summarise(MEAN=mean(Sepal.Length), SEM=SEM(Sepal.Length)) ->
Descriptive
print(Descriptive)
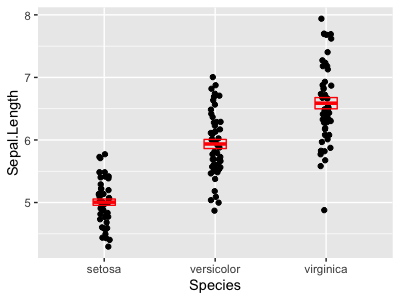
ggplot(iris, aes(x=Species, y=Sepal.Length))+
geom_point()+
stat_summary(fun=mean, shape=95, size=8, color=2)回答 2
Stack Overflow用户
发布于 2022-01-26 20:33:25
stat_summary函数可以处理所有这一切。fun参数设置中间值,但是您可以使用fun.data参数,它需要一个带有ymin、y和ymax值的dataframe --允许它生成错误条:
SEM <- function(x){data.frame(y=mean(x),
                              ymin=mean(x)-sd(x)/sqrt(length(x)),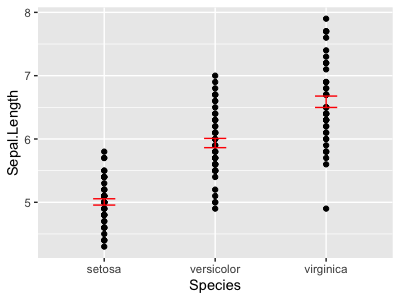
ymax=mean(x)+sd(x)/sqrt(length(x)))}现在,我们可以在geom='errorbar'中使用它来获得您想要的东西:
ggplot(iris, aes(x=Species, y=Sepal.Length))+
    geom_point() +
    stat_summary(fun.data=SEM, color = 'red', geom='errorbar', width=0.2)
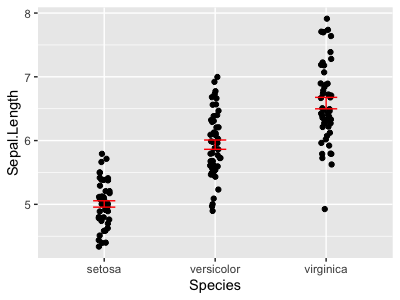
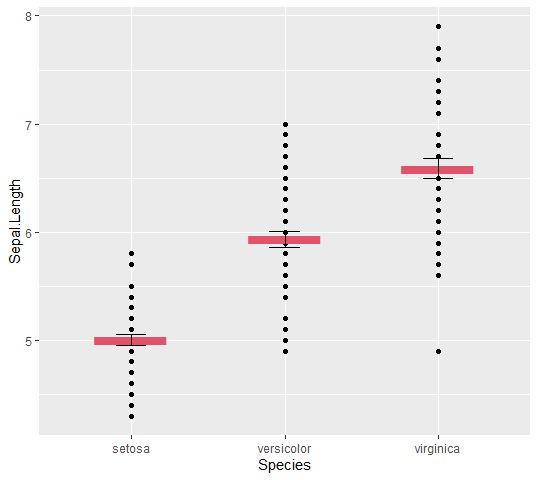
另一个问题是你有很多过高的计划。您可能需要使用geom_jitter来代替:
ggplot(iris, aes(x=Species, y=Sepal.Length))+
    geom_jitter(width=0.05) +
    stat_summary(fun.data=SEM, color = 'red', geom='errorbar', width=0.2)
根据您想要的内容,您可以使用不同的geom。
上面使用的"errorbar"给出了漂亮的条,但是没有自己标记的平均值(您需要像以前那样单独添加平均值:
ggplot(iris, aes(x=Species, y=Sepal.Length))+
    geom_jitter()+
    stat_summary(fun=mean, shape=95, size=6, color=2) +
    stat_summary(fun.data=SEM, color = 'red', geom='errorbar', width=0.2)
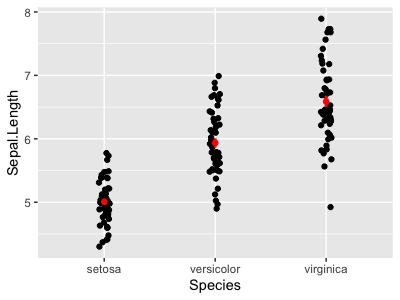
'pointrange'给出了一个点表示范围的平均值+线。如果增加size以使行更厚,则需要减少fatten参数,这会使点大于行。
ggplot(iris, aes(x=Species, y=Sepal.Length))+
    geom_jitter(width=0.05) +
    stat_summary(fun.data=SEM, color = 'red', geom='pointrange', size= 1, fatten=1)
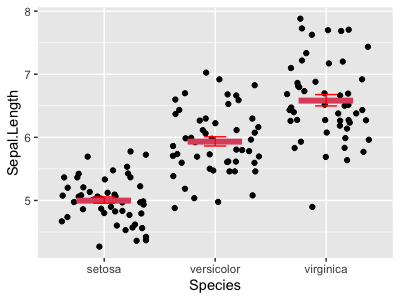
'crossbar'给出了一个带有均数和误差条的框:
ggplot(iris, aes(x=Species, y=Sepal.Length))+
    geom_jitter(width=0.05) +
    stat_summary(fun.data=SEM, color = 'red', geom='crossbar', width=0.2)
Stack Overflow用户
发布于 2022-01-26 20:30:37
这里有个办法。使用data参数向geom_errorbar传递数据集Descriptive。但这意味着您必须更改其他层中其余的data参数值。
ggplot() +
  geom_point(
    data = iris,
    mapping = aes(x=Species, y=Sepal.Length)) +
  stat_summary(
    data = iris,
    mapping = aes(x=Species, y=Sepal.Length),
    fun=mean, shape=95, size=8, color=2) +
  geom_errorbar(
    data = Descriptive,
    mapping = aes(x = Species, ymin = MEAN - SEM, ymax = MEAN + SEM),
    width = 0.2
  )
https://stackoverflow.com/questions/70868327
复制相似问题
腾讯云开发者

Copyright © 2013 - 2026 Tencent Cloud. All Rights Reserved. 腾讯云 版权所有
深圳市腾讯计算机系统有限公司 ICP备案/许可证号:粤B2-20090059 ![]() 粤公网安备44030502008569号
粤公网安备44030502008569号
腾讯云计算(北京)有限责任公司 京ICP证150476号 | 京ICP备11018762号