
Metis (python接口)最小的图形切割错误的结果(或使用?)
Metis (python接口)最小的图形切割错误的结果(或使用?)
提问于 2022-01-25 10:16:29
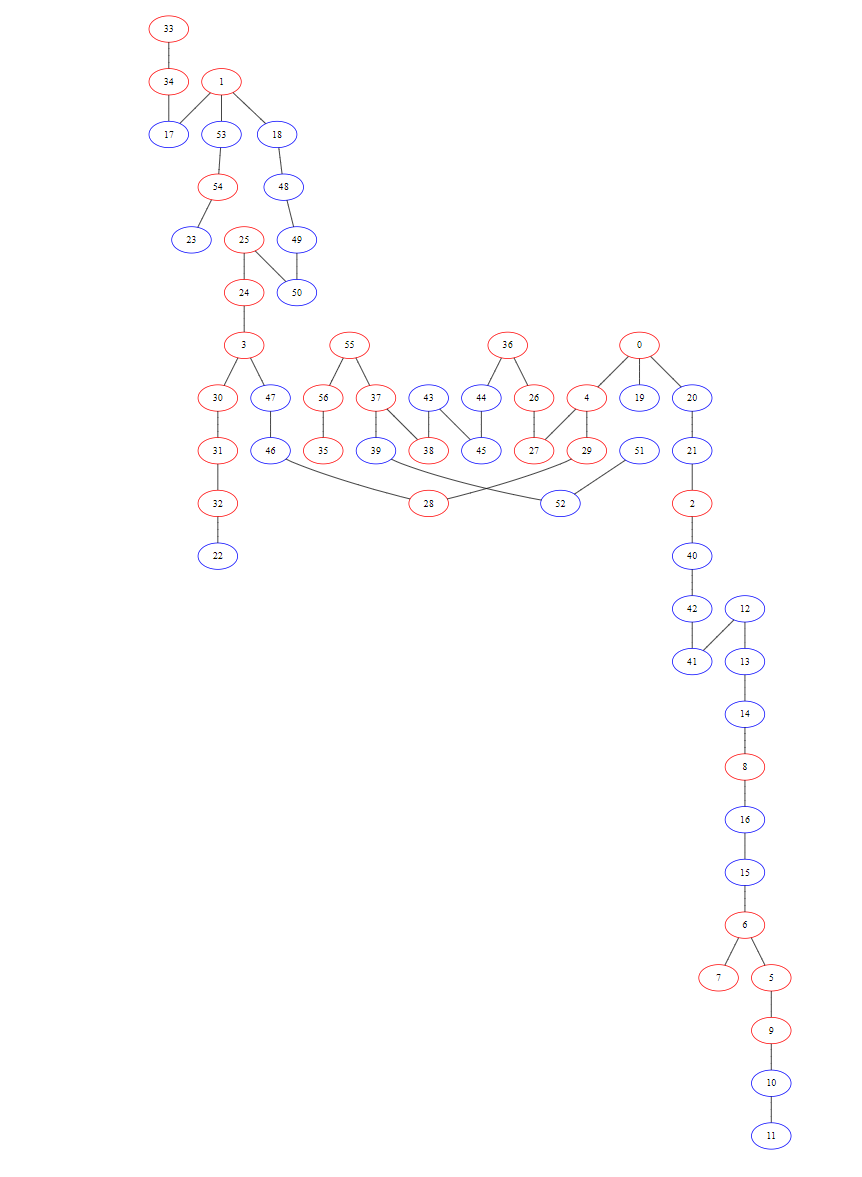
我试着用metis做一个简单的图划分。目标是在一定数量的k个分区的情况下,最小化图的割集成本。
我设置了一个小的简单的问题,所有的边都有高重量(不要削减),只有一个有低重量(请在这里剪)。
在这个示例中,我希望唯一的裁剪是节点3和24之间的边缘10,其权重为1。
Metis正在返回非常糟糕的结果,最底层的边缘没有被切割,而是到处都是(即使我设置contiguos = True)。削减成本似乎也是错误的。
我想听听比我更熟悉这类问题的人的意见。
这是我正在使用的python脚本:
import networkx as nx
import metis

#all edges have high weight, I expect the cut to be coming on edge 10 between node 3 an 24
edges=[(33, 34, 1000), (1, 18, 1000), (1, 17, 1000), (17, 34, 1000), (48, 49, 1000), (18, 48, 1000), (25, 50, 1000), (49, 50, 1000), (24, 25, 1000), (3, 30, 1000), (3, 24, 1), (31, 32, 1000), (30, 31, 1000), (22, 32, 1000), (3, 47, 1000), (46, 47, 1000), (0, 20, 1000), (0, 4, 1000), (4, 29, 1000), (28, 29, 1000), (28, 46, 1000), (20, 21, 1000), (2, 21, 1000), (40, 42, 1000), (2, 40, 1000), (12, 41, 1000), (41, 42, 1000), (13, 14, 1000), (12, 13, 1000), (8, 16, 1000), (8, 14, 1000), (15, 16, 1000), (6, 7, 1000), (6, 15, 1000), (5, 6, 1000), (5, 9, 1000), (10, 11, 1000), (9, 10, 1000), (0, 19, 1000), (36, 44, 1000), (26, 36, 1000), (26, 27, 1000), (4, 27, 1000), (43, 45, 1000), (44, 45, 1000), (55, 56, 1000), (37, 55, 1000), (37, 38, 1000), (38, 43, 1000), (35, 56, 1000), (37, 39, 1000), (51, 52, 1000), (39, 52, 1000), (53, 54, 1000), (1, 53, 1000), (23, 54, 1000)]

ne = len(edges)

G = nx.Graph()
G.add_weighted_edges_from(edges)

print(G.number_of_edges())
print(G.number_of_nodes())

# Add node weights to graph
for i in range(G.number_of_nodes()):
    G.nodes[i]['node_value'] = 1


# tell METIS which node attribute to use for
G.graph['node_weight_attr'] = 'node_value'
G.graph['edge_weight_attr']='weight'


# Check graph attributes for weight/size labels
edgew = G.graph.get('edge_weight_attr', None)
nodew = G.graph.get('node_weight_attr', [])
nodesz = G.graph.get('node_size_attr', None)


# Get at MOST two partitions from METIS
(cutcost, parts) = metis.part_graph(G, nparts = 2, objtype="cut")

#parts [0, 0, 0, 0, 0, 0, 0, 0, 0, 0, 1, 1, 1, 1, 1, 1, 1, 1, 1, 1, 1, 1, 1, 1, 0, 0, 0, 0, 0, 0, 0, 0, 0, 0, 0, 0, 0, 0, 0, 1, 1, 1, 1, 1, 1, 1, 1, 1, 1, 1, 1, 1, 1, 1, 0, 0, 0]
#cutcost 1001


#???????????????????????????????????

print(parts)

# Assuming you have PyDot installed, produce a DOT description of the graph:
colors = ['red', 'blue']
for i, part in enumerate(parts):
    G.nodes[i]['color'] = colors[part]
nx.nx_pydot.write_dot(G, 'example.dot')
在这里,石墨画:
回答 1
Stack Overflow用户
发布于 2022-11-17 03:48:55
您可以推送代码
G.graph['edge_weight_attr'] = 'weight'在将图传递给函数之前
页面原文内容由Stack Overflow提供。腾讯云小微IT领域专用引擎提供翻译支持
原文链接:
https://stackoverflow.com/questions/70846886
复制相关文章
相似问题
腾讯云开发者

Copyright © 2013 - 2026 Tencent Cloud. All Rights Reserved. 腾讯云 版权所有
深圳市腾讯计算机系统有限公司 ICP备案/许可证号:粤B2-20090059 ![]() 粤公网安备44030502008569号
粤公网安备44030502008569号
腾讯云计算(北京)有限责任公司 京ICP证150476号 | 京ICP备11018762号