
假阳性与假阴性权衡情节
假阳性与假阴性权衡情节
提问于 2022-01-24 23:46:05
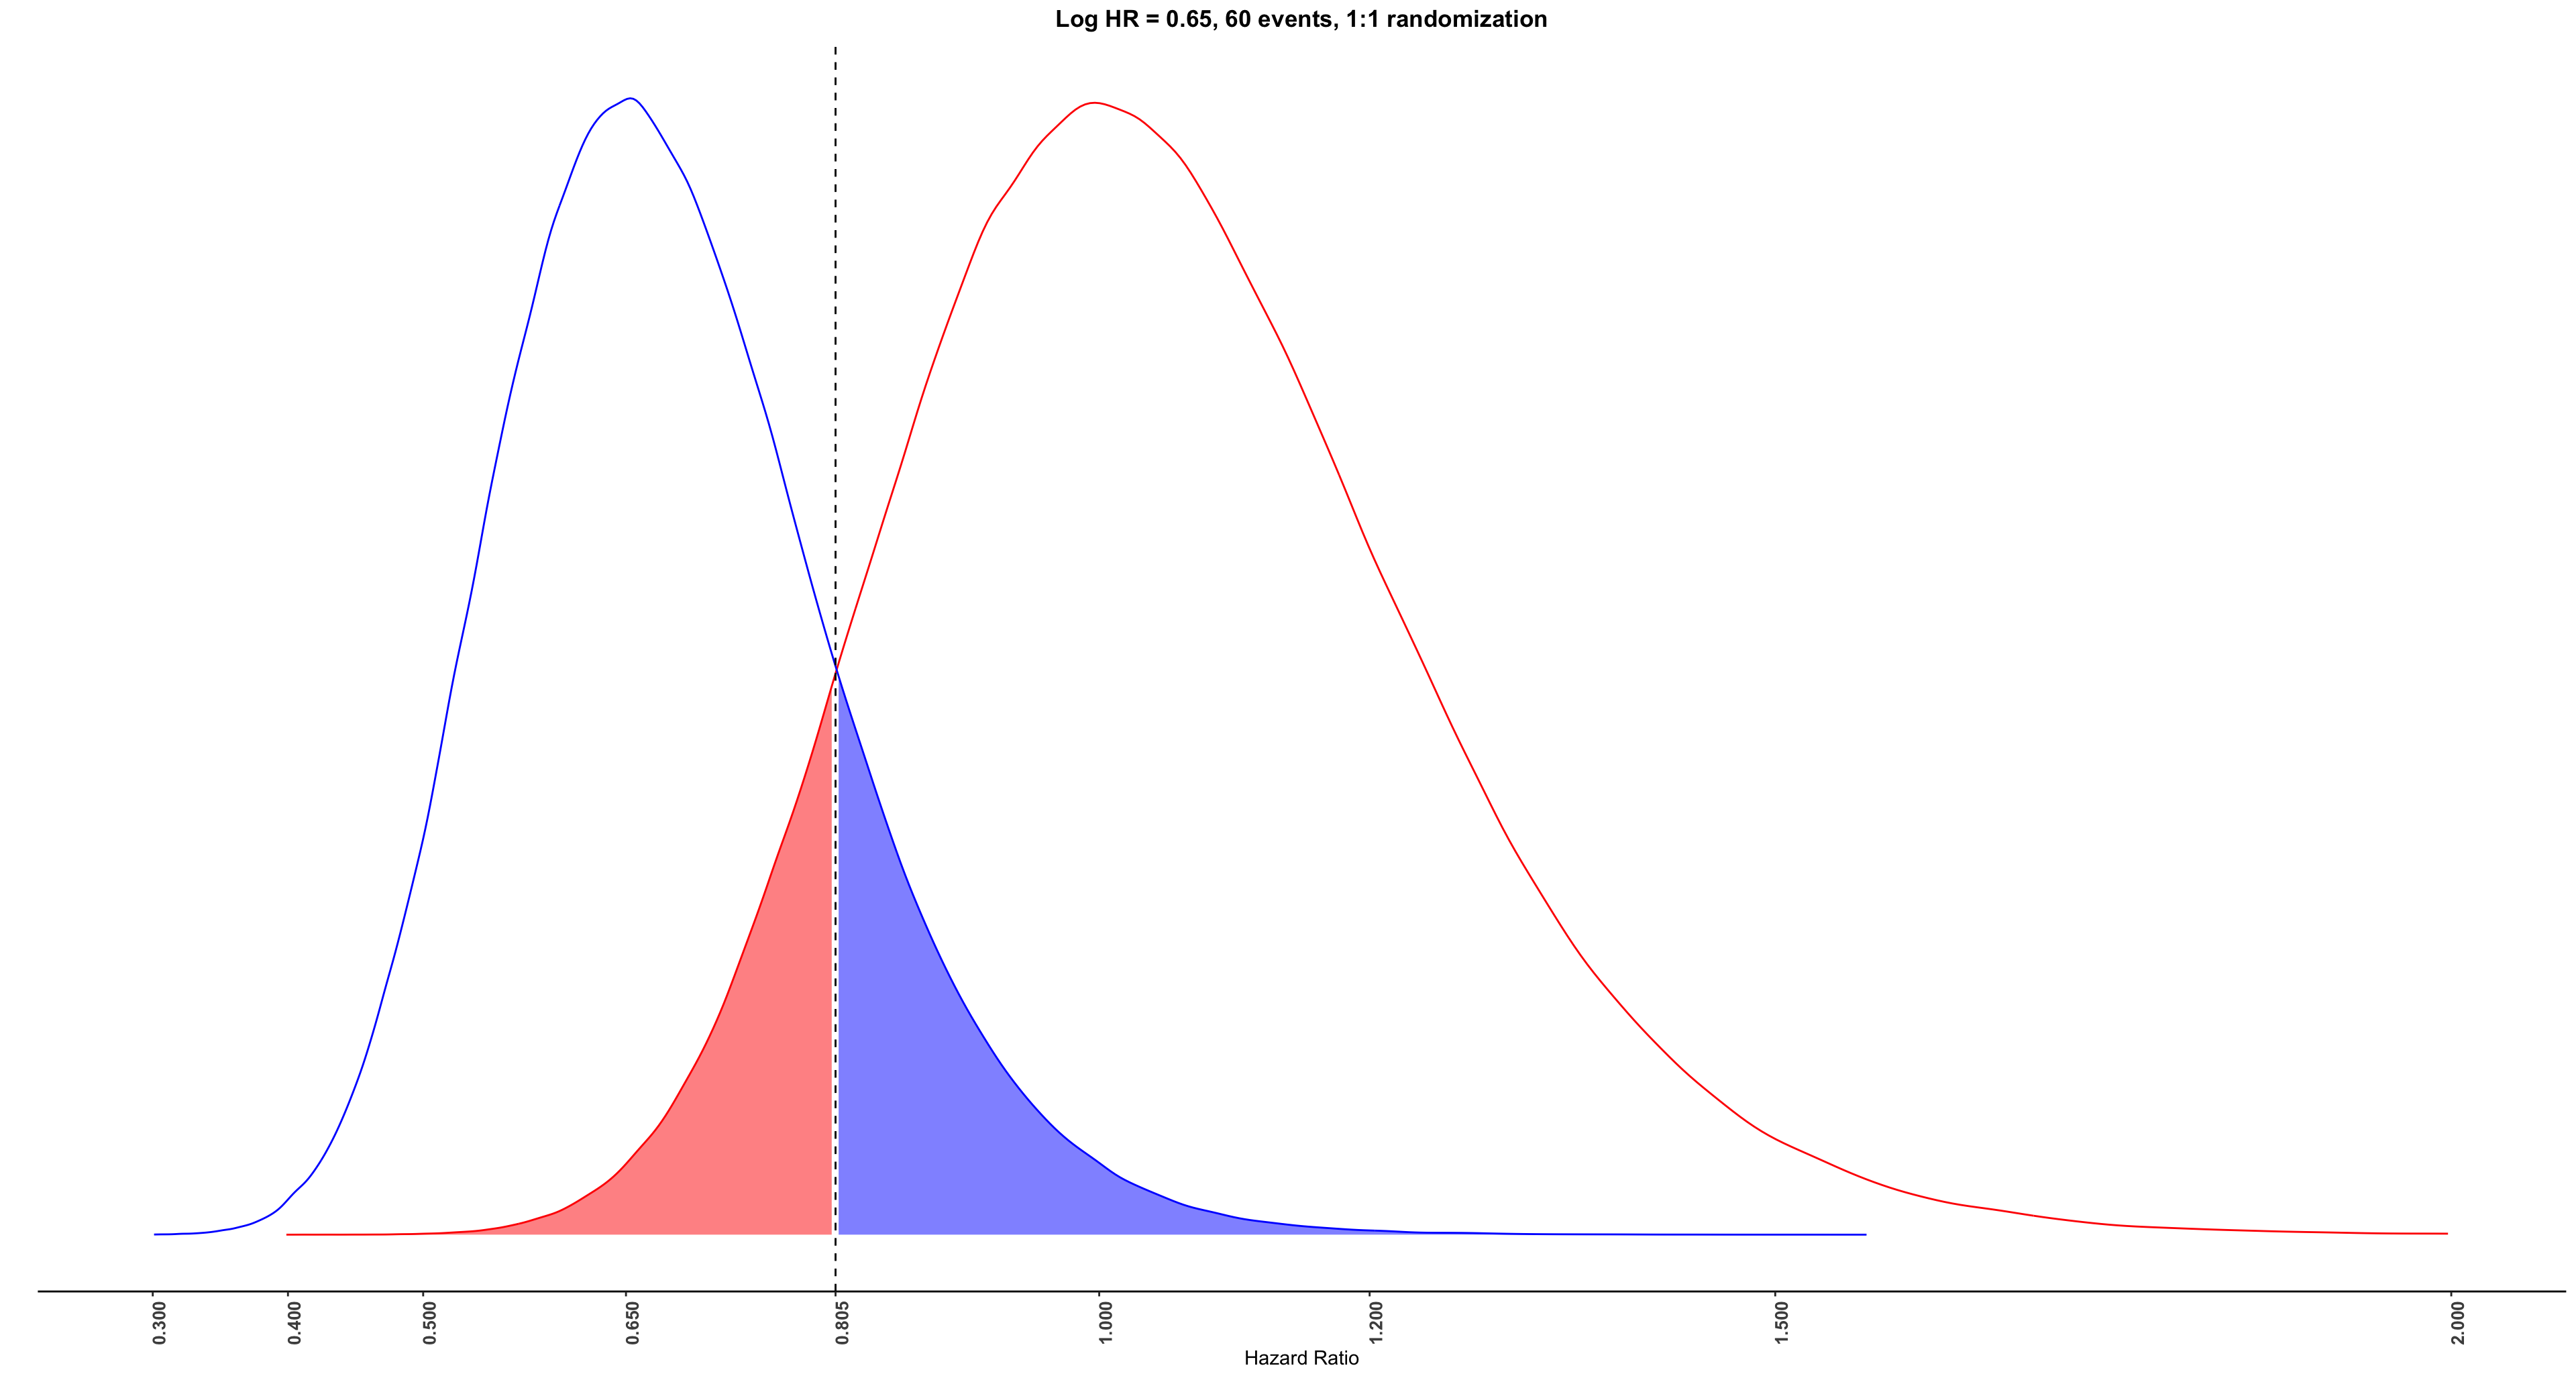
我正在做一个决策分析,我试图用R来说明假阳性(假go)和假阴性(假不去)之间的权衡,我用零和替代假设曲线创建了一个密度图,但是我想通过这样的例子来进一步说明这种关系。希望能帮助你创建像例1和2这样的情节,特别是示例1。谢谢!
密度图
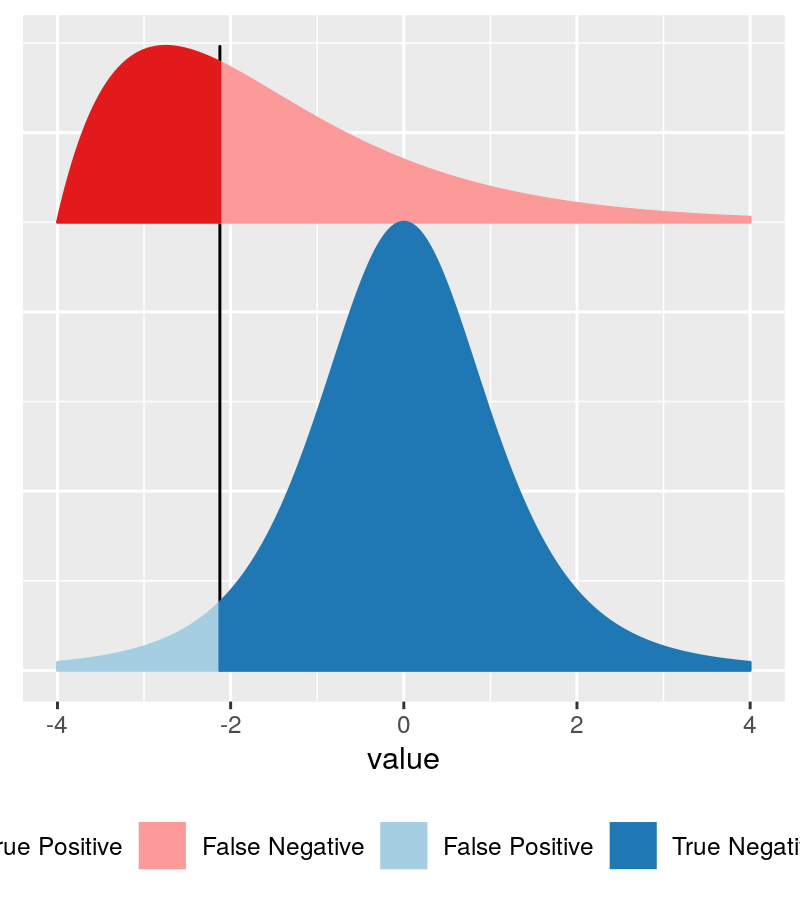
示例1
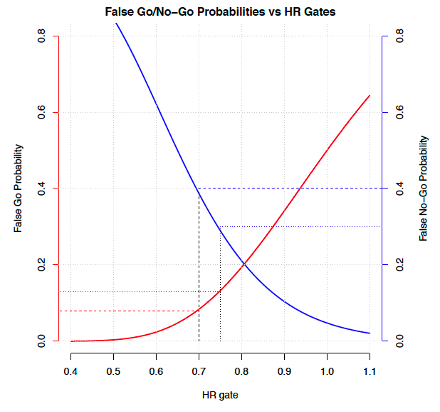
示例2
回答 2
Stack Overflow用户
回答已采纳
发布于 2022-01-25 03:43:16
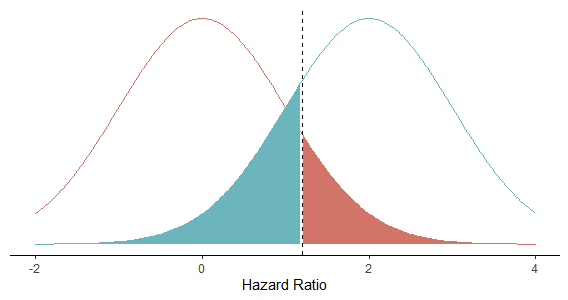
我使用了两个偏移的正态分布,这个前提包含了你能想象到的任何曲线。
library(ggplot2)

xs <- seq(-2, 4, length.out = 201)
dat <- do.call(rbind,
  list(data.frame(x=xs, y=dnorm(xs), id="1"),
       data.frame(x=xs, y=dnorm(xs, 2), id="2")))
地块1
vline <- 1
eps <- 1e-3

ggplot(dat, aes(x, y, group = id, color = id)) +
  geom_line() +
  geom_area(aes(fill = id),
            data = ~ subset(., (id == "1" & x > (vline+eps)) | (id == "2" & x < (vline-eps)))) +
  geom_vline(xintercept = vline, linetype = "dashed") +
  labs(x = "Hazard Ratio", y = NULL) +
  guides(color = "none", fill = "none") +
  theme_classic() +
  theme(
    axis.line.y = element_blank(),
    axis.text.y = element_blank(),
    axis.ticks.y = element_blank()
  )
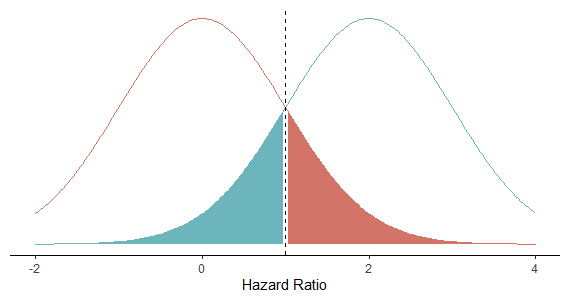
vline是这里的微分线,如果它不在交点处,那么它仍然是有用的。例如,
vline <- 1.2
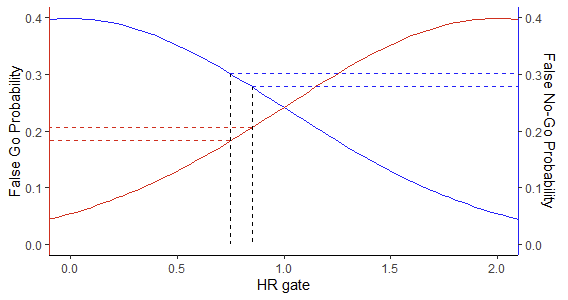
地块2
rng <- c(0.75, 0.85)
rngdat <- do.call(rbind,
  by(dat, dat$id, function(z) with(z, data.frame(approx(x, y, xout = rng), id = id[1]))))
rngdat$otherx <- fifelse(rngdat$id == "1", Inf, -Inf)

ggplot(dat, aes(x, y, group = id, color = id)) +
  geom_line(na.rm = TRUE) +
  geom_segment(aes(xend = x, yend = 0),
               data = subset(rngdat, id == 1),
               color = "black", linetype = "dashed") +
  geom_segment(aes(xend = otherx, yend = y),
               data = rngdat, linetype = "dashed") +
  coord_cartesian(xlim = c(0, 2)) +
  scale_x_continuous(name = "HR gate") +
  scale_y_continuous(
    name = "False Go Probability",
    sec.axis = sec_axis(~ ., name = "False No-Go Probability")) +
  scale_color_manual(values = c("1" = "blue", "2" = "red")) +
  guides(color = "none") +
  theme_classic() +
  theme(
    axis.line.y.left = element_line(color = "red"),
    axis.line.y.right = element_line(color = "blue")
  )
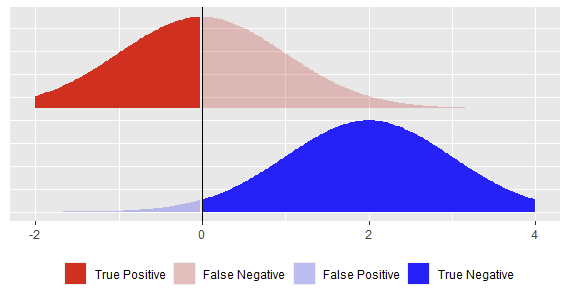
第3号地块
offset <- max(rngdat$y[rngdat$id == "1"]) + 0.1
cutoff <- 0
dat <- transform(
  dat,
  yoff = ifelse(id == "1", 0.05 + offset, 0),
  cat = ifelse(id == "1",
               ifelse(x < cutoff, "True Positive", "False Negative"),
               ifelse(x < cutoff, "False Positive", "True Negative")))

ggplot(dat, aes(x, y = y + yoff)) +
  geom_ribbon(aes(ymin = yoff, ymax = y + yoff,
                  group = cat, fill = cat, alpha = cat),
              na.rm = TRUE) +
  geom_vline(xintercept = cutoff) +
  scale_fill_manual(
    name = NULL,
    values = c("True Positive" = "red", "False Negative" = "red",
               "False Positive" = "blue", "True Negative" = "blue")) +
  scale_alpha_manual(
    name = NULL,
    values = c("True Positive" = 1, "False Negative" = 0.2,
               "False Positive" = 0.2, "True Negative" = 1)) +
  labs(x = NULL, y = NULL) +
  theme(
    legend.position = "bottom",
    axis.text.y = element_blank(),
    axis.ticks.y = element_blank()
  )
Stack Overflow用户
发布于 2022-01-25 00:16:38
看起来你的症结在于弄清楚如何在x或y的给定值下访问密度曲线的值。
您可以使用ggplot_build()访问由geom_density函数构造的底层data.frame。下面是一些进一步的讨论。
页面原文内容由Stack Overflow提供。腾讯云小微IT领域专用引擎提供翻译支持
原文链接:
https://stackoverflow.com/questions/70841834
复制相关文章
相似问题
腾讯云开发者

Copyright © 2013 - 2026 Tencent Cloud. All Rights Reserved. 腾讯云 版权所有
深圳市腾讯计算机系统有限公司 ICP备案/许可证号:粤B2-20090059 ![]() 粤公网安备44030502008569号
粤公网安备44030502008569号
腾讯云计算(北京)有限责任公司 京ICP证150476号 | 京ICP备11018762号