
如何根据分类数据的频率创建矩阵库曲面图
如何根据分类数据的频率创建矩阵库曲面图
提问于 2022-01-22 09:35:06
我有一个(示例) dataframe,如下所示:
    time                  event type
0   2022-01-22 10:35:00     a
1   2022-01-22 11:37:00     a
2   2022-01-22 22:22:00     b
3   2022-01-22 12:05:00     b
4   2022-01-22 10:09:00     c
5   2022-01-22 10:57:00     a
6   2022-01-22 11:36:00     c
7   2022-01-22 09:45:00     a
我想要创建一个3D表面图,显示每小时从每种类型发生多少事件。地块的轴线应该是:
 X: hour
 Y: event type
Y: number of events我希望在X轴上看到:9, 10, 11, 12 ,22,在Y轴上看到:a, b, c。对于Z轴,值应该反映每小时每种类型的事件数。例如X=10, Y=a, Z=2
我看了文档和各种例子,但找不到答案。
回答 1
Stack Overflow用户
回答已采纳
发布于 2022-01-22 12:32:05
这需要两项任务。首先,您必须聚合您的数据以计数唯一对hour-event type-event count -event type,然后根据聚合的hour-event type数据创建3D图:
from matplotlib import pyplot as plt
from matplotlib.ticker import MaxNLocator
import pandas as pd
import numpy as np
#test data
np.random.seed(123)
n = 10
start = pd.to_datetime("2021-04-21")
end = pd.to_datetime("2021-04-23")
n_minut = ((end - start).days + 1) * 24 * 60
date_range = pd.to_timedelta(np.random.randint(0, n_minut, n), unit="minute") + start
df = pd.DataFrame({"time": date_range, "event type": np.random.choice(list("abcde"), n)})
#count event types per hour
plot_df = df. groupby([df["time"].dt.hour, df["event type"]]).size().reset_index(name="event count")
#transcribe categorical data in column "event type" into integer values
#idx contains the list of event types according to their integer numbers
val, idx = plot_df["event type"].factorize()
plot_df["event_num"] = val
#generate evenly spaced x- and y-values
x_range = np.arange(24)
y_range = np.arange(idx.size)
#and create x-y arrays for the 3D plot
X, Y = np.meshgrid(x_range, y_range)
#and fill z-values with zeros
Z = np.zeros(X.shape)
#or the event count, if exists
Z[plot_df["event_num"], plot_df["time"]] = plot_df["event count"]
#create figure with a 3D projection axis
fig = plt.figure()
ax = fig.add_subplot(111, projection="3d")
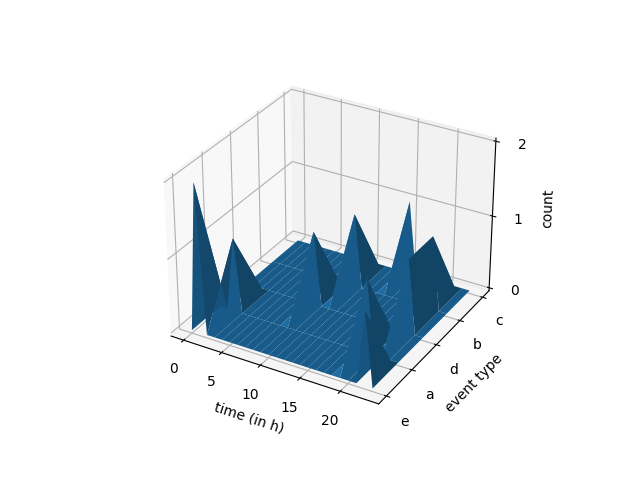
ax.plot_surface(X, Y, Z)
ax.zaxis.set_major_locator(MaxNLocator(integer=True))
ax.set_yticks(y_range, idx)
ax.set_ylabel("event type")
ax.set_xlabel("time (in h)")
ax.set_zlabel("count")
plt.show()样本输出:
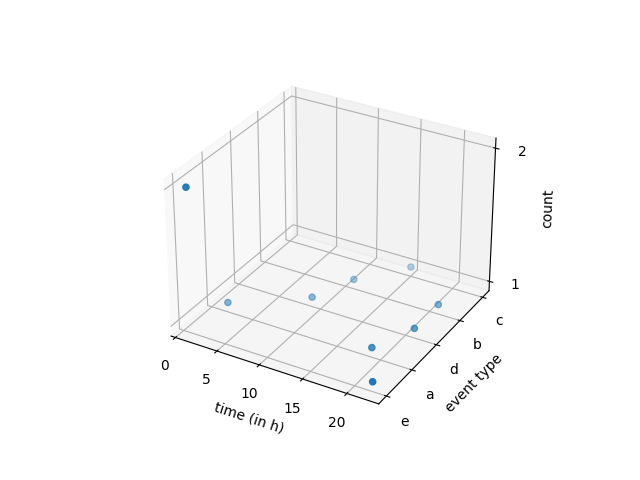
然而,众所周知,matplotlib有时在绘制表面时会出现问题,以正确的可见性顺序绘制曲面.根据您的数据,使用散点图可能会更好:
...
X, Y = np.meshgrid(x_range, y_range)
Z = np.full(X.shape, np.nan)
Z[plot_df["event_num"], plot_df["time"]] = plot_df["event count"]

fig = plt.figure()
ax = fig.add_subplot(111, projection="3d")

ax.scatter(X, Y, Z)

ax.zaxis.set_major_locator(MaxNLocator(integer=True))
...
页面原文内容由Stack Overflow提供。腾讯云小微IT领域专用引擎提供翻译支持
原文链接:
https://stackoverflow.com/questions/70811568
复制相关文章
相似问题
腾讯云开发者

Copyright © 2013 - 2026 Tencent Cloud. All Rights Reserved. 腾讯云 版权所有
深圳市腾讯计算机系统有限公司 ICP备案/许可证号:粤B2-20090059 ![]() 粤公网安备44030502008569号
粤公网安备44030502008569号
腾讯云计算(北京)有限责任公司 京ICP证150476号 | 京ICP备11018762号