
在“`python`”中在一个图形中绘制符号函数和点
在“`python`”中在一个图形中绘制符号函数和点
提问于 2022-01-20 07:00:12
import sympy
import matplotlib.pyplot as plt
from sympy import plot
x=sympy.symbols('x')
f=(x**2-4)**2/8-1
plot(f,(x,0,3),xlabel='x',ylabel='y',label='$f(x)$')
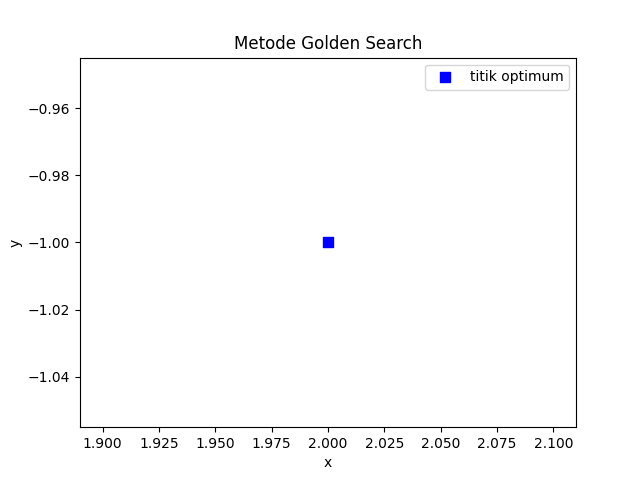
plt.scatter(2,-1,label="titik optimum",color="blue",marker="s",s=50)
plt.xlabel('x')
plt.ylabel('y')
plt.title('Metode Golden Search')
plt.legend()
plt.show()
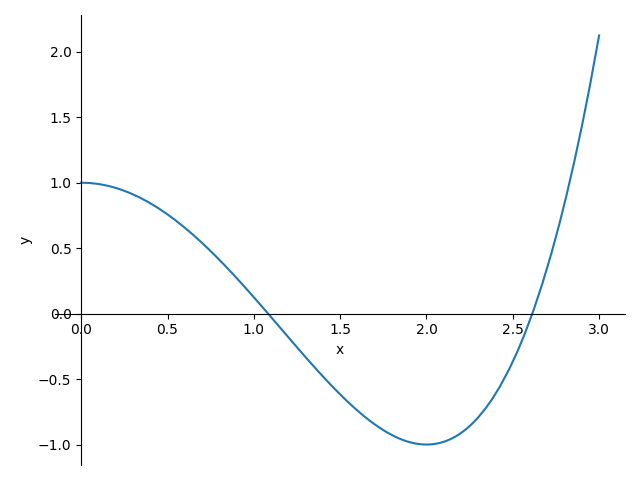
我想把符号函数和点画成一个图形。但其结果是符号函数图与点图分离。任何人都知道如何在python中以一个图形显示绘图符号函数和点。
回答 1
Stack Overflow用户
回答已采纳
发布于 2022-03-15 08:18:45
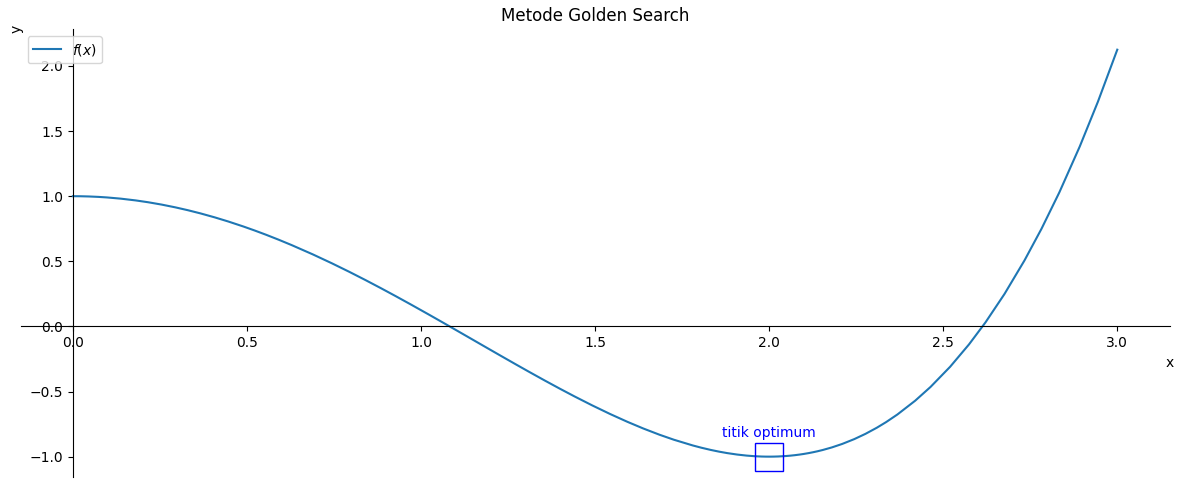
Sympy的阴谋supports markers= and annotations= keywords。这些是matplotlib的plot和annotate函数的字典列表。这些标记似乎没有出现在图例中,但您可以使用注释。
from sympy import symbols, plot

x = symbols('x')
f = (x ** 2 - 4) ** 2 / 8 - 1
plot(f, (x, 0, 3), xlabel='x', ylabel='y', label='$f(x)$', title='Metode Golden Search', legend=True, size=(12, 5),
     markers=[{'args': [2, -1], 'mfc': "none", 'mec': "blue", 'marker': "s", 'ms': 20}],
     annotations=[{'xy': (2, -1), 'text': "titik optimum\n", 'ha': 'center', 'va': 'bottom', 'color': 'blue'}])
页面原文内容由Stack Overflow提供。腾讯云小微IT领域专用引擎提供翻译支持
原文链接:
https://stackoverflow.com/questions/70781940
复制相关文章
相似问题
腾讯云开发者

Copyright © 2013 - 2026 Tencent Cloud. All Rights Reserved. 腾讯云 版权所有
深圳市腾讯计算机系统有限公司 ICP备案/许可证号:粤B2-20090059 ![]() 粤公网安备44030502008569号
粤公网安备44030502008569号
腾讯云计算(北京)有限责任公司 京ICP证150476号 | 京ICP备11018762号