
反迭代RStan
反迭代RStan
提问于 2022-01-19 11:25:33
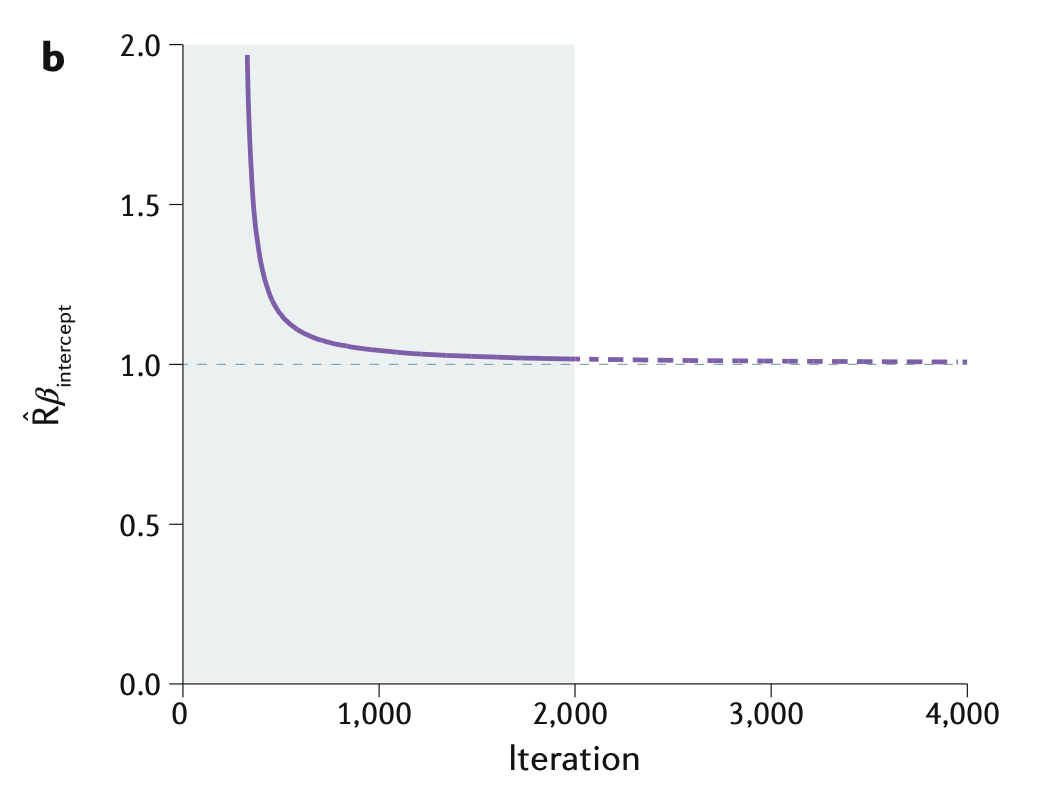
我试图生成如下类似的图,以显示R-hat在迭代过程中的变化:
我尝试了以下几种选择:
summary(fit1)$summary:给R-hat所有链合并summary(fit1)$c_summary:给出每个链的R-hat
您能帮我获得给定参数的每次迭代的R-hat吗?
回答 1
Stack Overflow用户
回答已采纳
发布于 2022-02-04 22:51:43
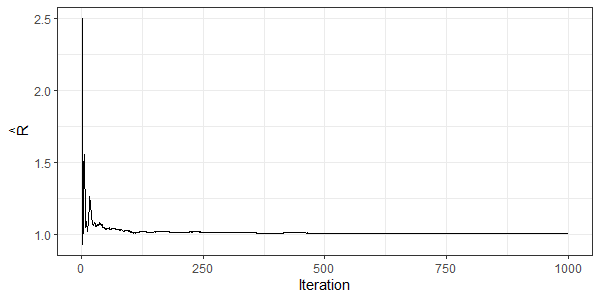
rstan提供了Rhat()函数,它接受迭代x链的矩阵并返回R。我们可以从拟合的模型中提取出这个矩阵,并在其上累计应用Rhat()。下面的代码以8所学校模型为例(复制自入门指南)。
library(tidyverse)
library(purrr)
library(rstan)
theme_set(theme_bw())

# Fit the 8 schools model.
schools_dat <- list(J = 8,
                    y = c(28,  8, -3,  7, -1,  1, 18, 12),
                    sigma = c(15, 10, 16, 11,  9, 11, 10, 18))
fit <- stan(file = 'schools.stan', data = schools_dat)

# Extract draws for mu as a matrix; columns are chains and rows are iterations.
mu_draws = as.array(fit)[,,"mu"]

# Get the cumulative R-hat as of each iteration.
mu_rhat = map_dfr(
  1:nrow(mu_draws),
  function(i) {
    return(data.frame(iteration = i,
                      rhat = Rhat(mu_draws[1:i,])))
  }
)

# Plot iteration against R-hat.
mu_rhat %>%
  ggplot(aes(x = iteration, y = rhat)) +
  geom_line() +
  labs(x = "Iteration", y = expression(hat(R)))
页面原文内容由Stack Overflow提供。腾讯云小微IT领域专用引擎提供翻译支持
原文链接:
https://stackoverflow.com/questions/70769744
复制相关文章
相似问题
腾讯云开发者

Copyright © 2013 - 2026 Tencent Cloud. All Rights Reserved. 腾讯云 版权所有
深圳市腾讯计算机系统有限公司 ICP备案/许可证号:粤B2-20090059 ![]() 粤公网安备44030502008569号
粤公网安备44030502008569号
腾讯云计算(北京)有限责任公司 京ICP证150476号 | 京ICP备11018762号