
用于类似查询的Postgresql物化视图的不同性能
用于类似查询的Postgresql物化视图的不同性能
提问于 2022-01-12 10:18:43
我有一个包含3列的表:id(串行)、jsonbData(jsonb)、date(时间戳)和3.200.000行。我从这个表创建了一个物化视图,它的列与表完全相同。物化视图和表都有jsonb键和日期列的btree索引。
我在表和视图上执行这个查询。(endDate和startDate是静态的):
select * from table/matView where date <= endDate and date >= startDate and jsonbData ->> 'name' = x 物化视图和表的性能几乎相同,但每当我更改查询时,它就会选择randomDate作为endDate,而选择randomDate - 180天作为startDate,表的执行时间不会改变,但物化视图所花费的时间几乎是以前的4倍。我不知道物化视图性能下降的原因是什么。表和物化视图之间唯一的区别是表上的id列是主键,上面有索引。
表:
CREATE TABLE app_fraud (
    app_data_id serial4 NOT NULL,
    app_content jsonb NULL,
    created_at timestamp NULL,
    CONSTRAINT app_fraud_pkey PRIMARY KEY (app_data_id)
);

CREATE INDEX app_fraud_created_at_idx ON app_fraud USING btree (created_at);
CREATE INDEX app_fraud_expr_idx ON app_fraud USING btree (((app_content ->> 'ma_TCKN'::text)));
物化视图:
create materialized view app_fraud_mat_view as select app_data_id, app_content, created_at from app_fraud;

CREATE INDEX app_fraud_created_at_idx22 ON app_fraud_mat_view USING btree (created_at);
CREATE INDEX app_fraud_expr_idx22 ON app_fraud_mat_view USING btree (((app_content ->> 'ma_TCKN'::text)));
表的解释分析查询:
explain(analyze,buffers)
select * from app_fraud where created_at <= '2020-12-19' and created_at >= '2019-01-01' and app_content ->> 'ma_TCKN' = '1611738921030';
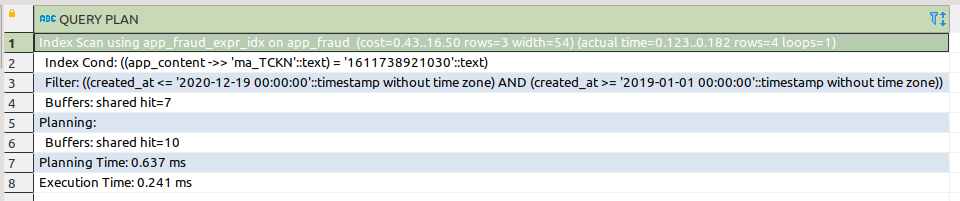
解释物化视图的分析查询:
explain(analyze,buffers)
select * from app_fraud_mat_view where created_at <= '2020-12-19' and created_at >= '2019-01-01' and app_content ->> 'ma_TCKN' = '1611738921030';
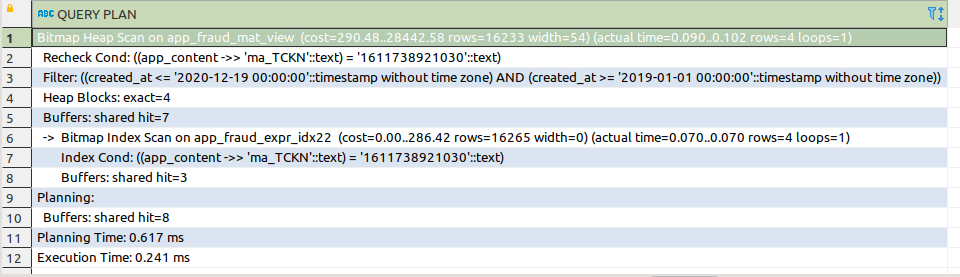
回答 1
Stack Overflow用户
发布于 2022-01-13 10:15:42
在分析了物化的观点之后,尽管我不知道为什么,但问题已经解决了。
页面原文内容由Stack Overflow提供。腾讯云小微IT领域专用引擎提供翻译支持
原文链接:
https://stackoverflow.com/questions/70679801
复制相关文章
相似问题
腾讯云开发者

Copyright © 2013 - 2026 Tencent Cloud. All Rights Reserved. 腾讯云 版权所有
深圳市腾讯计算机系统有限公司 ICP备案/许可证号:粤B2-20090059  粤公网安备44030502008569号
腾讯云计算(北京)有限责任公司 京ICP证150476号 | 京ICP备11018762号