
当我将木星笔记本转换成PDF时,我能很好地打印linearmodels.panel.results.compare()的输出吗?
我使用Python来分析木星笔记本中的数据,我将这些数据转换为PDF与共同作者(jupyter nbconvert --to pdf)共享。我经常使用linearmodels.panel.results.compare()来比较来自linearmodels包的面板回归估计值。但是,PDF转换过程将compare()输出转换为对PDF太宽的固定宽度字体(我将提供下面的代码):
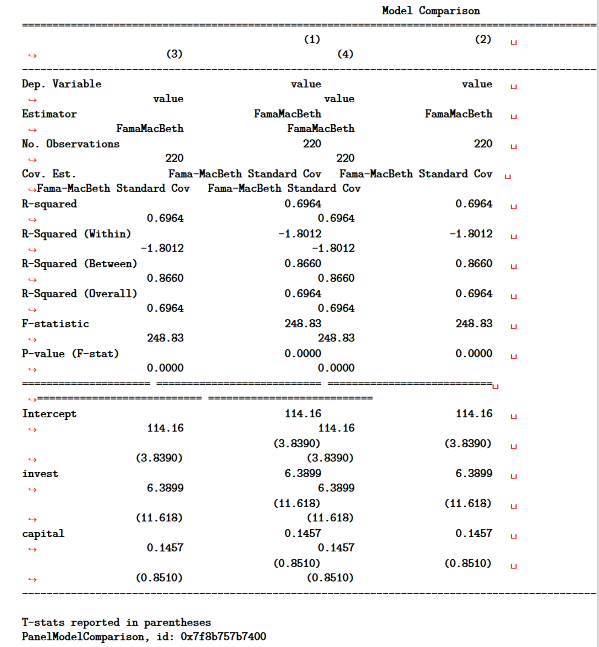
当我将木星笔记本转换成PDF时,我能很好地打印compare()的输出吗?
一种可能的解决方案是将compare()输出转换为数据帧。选项pd.options.display.latex.repr = True漂亮打印数据帧时,我转换为PDF。例如:
在笔记本中,compare()输出格式很好,看起来像一个数据框架。但是,它不是数据框架,我没有将它转换为数据框架。
是否有一种替代的解决方案来比较linearmodels包输出的漂亮打印结果?
下面是生成上述表的代码(复制并粘贴到木星笔记本代码单元格中):
import pandas as pd
from linearmodels.panel import FamaMacBeth
from linearmodels.panel.results import compare
pd.options.display.latex.repr = True
from statsmodels.datasets import grunfeld
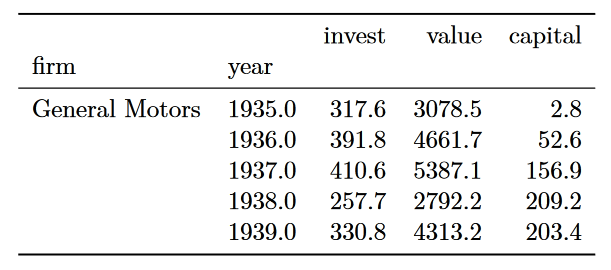
df = grunfeld.load_pandas().data
df.set_index(['firm','year'], inplace=True)
display(df.head())
table = {
'(1)': FamaMacBeth.from_formula(formula='value ~ 1 + invest + capital', data=df).fit(),
'(2)': FamaMacBeth.from_formula(formula='value ~ 1 + invest + capital', data=df).fit(),
'(3)': FamaMacBeth.from_formula(formula='value ~ 1 + invest + capital', data=df).fit(),
'(4)': FamaMacBeth.from_formula(formula='value ~ 1 + invest + capital', data=df).fit()
}
display(compare(table))回答 2
Stack Overflow用户
发布于 2022-01-05 10:17:37
compare返回一个PanelModelComparison。这个类有一个属性summary,它返回一个与状态模型中可用的Summary对象几乎相同的linearmodels.compat.statsmodels.Summary。Summary实例有一个方法as_latex(),它将表转换为LaTeX。
import pandas as pd
from linearmodels.panel import FamaMacBeth
from linearmodels.panel.results import compare

pd.options.display.latex.repr = True

from statsmodels.datasets import grunfeld
df = grunfeld.load_pandas().data
df.set_index(['firm','year'], inplace=True)

display(df.head())

table = {
    '(1)': FamaMacBeth.from_formula(formula='value ~ 1 + invest + capital', data=df).fit(),
    '(2)': FamaMacBeth.from_formula(formula='value ~ 1 + invest + capital', data=df).fit(),
    '(3)': FamaMacBeth.from_formula(formula='value ~ 1 + invest + capital', data=df).fit(),
    '(4)': FamaMacBeth.from_formula(formula='value ~ 1 + invest + capital', data=df).fit()
}

display(compare(table))
comparrison = compare(table)
summary = comparrison.summary
print(summary.as_latex())
这个指纹
\begin{center}
\begin{tabular}{lcccc}
\toprule
                               &         \textbf{(1)}        &         \textbf{(2)}        &         \textbf{(3)}        &         \textbf{(4)}         \\
\midrule
\textbf{Dep. Variable}         &            value            &            value            &            value            &            value             \\
\textbf{Estimator}             &         FamaMacBeth         &         FamaMacBeth         &         FamaMacBeth         &         FamaMacBeth          \\
\textbf{No. Observations}      &             220             &             220             &             220             &             220              \\
\textbf{Cov. Est.}             &  Fama-MacBeth Standard Cov  &  Fama-MacBeth Standard Cov  &  Fama-MacBeth Standard Cov  &  Fama-MacBeth Standard Cov   \\
\textbf{R-squared}             &            0.6964           &            0.6964           &            0.6964           &            0.6964            \\
\textbf{R-Squared (Within)}    &           -1.8012           &           -1.8012           &           -1.8012           &           -1.8012            \\
\textbf{R-Squared (Between)}   &            0.8660           &            0.8660           &            0.8660           &            0.8660            \\
\textbf{R-Squared (Overall)}   &            0.6964           &            0.6964           &            0.6964           &            0.6964            \\
\textbf{F-statistic}           &            248.83           &            248.83           &            248.83           &            248.83            \\
\textbf{P-value (F-stat)}      &            0.0000           &            0.0000           &            0.0000           &            0.0000            \\
\textbf{=====================} & =========================== & =========================== & =========================== & ===========================  \\
\textbf{Intercept}             &            114.16           &            114.16           &            114.16           &            114.16            \\
\textbf{ }                     &           (3.8390)          &           (3.8390)          &           (3.8390)          &           (3.8390)           \\
\textbf{capital}               &            0.1457           &            0.1457           &            0.1457           &            0.1457            \\
\textbf{ }                     &           (0.8510)          &           (0.8510)          &           (0.8510)          &           (0.8510)           \\
\textbf{invest}                &            6.3899           &            6.3899           &            6.3899           &            6.3899            \\
\textbf{ }                     &           (11.618)          &           (11.618)          &           (11.618)          &           (11.618)           \\
\bottomrule
\end{tabular}
%\caption{Model Comparison}
\end{center}

T-stats reported in parenthesesStack Overflow用户
发布于 2022-01-05 16:11:24
下面是使用Kevin .的.summary.as_latex()的另一种方法,下面的函数使用compare().summary创建数据框架,jupyter nbconvert --to pdf将其转换为表。
from io import StringIO
import warnings

def compare_df(x, fit_stats=['Estimator', 'R-squared', 'No. Observations']):
    with warnings.catch_warnings():
        warnings.simplefilter(action='ignore', category=FutureWarning)
        y = pd.read_csv(StringIO(compare(x, stars=True).summary.as_csv()), skiprows=1, skipfooter=1, engine='python')
    z = pd.DataFrame(
        data=y.iloc[:, 1:].values,
        index=y.iloc[:, 0].str.strip(),
        columns=pd.MultiIndex.from_arrays(
            arrays=[y.columns[1:], y.iloc[0][1:]],
            names=['Model', 'Dep. Var.']
        )
    )
    return pd.concat([z.iloc[11:], z.loc[fit_stats]])
PDF输出如下:
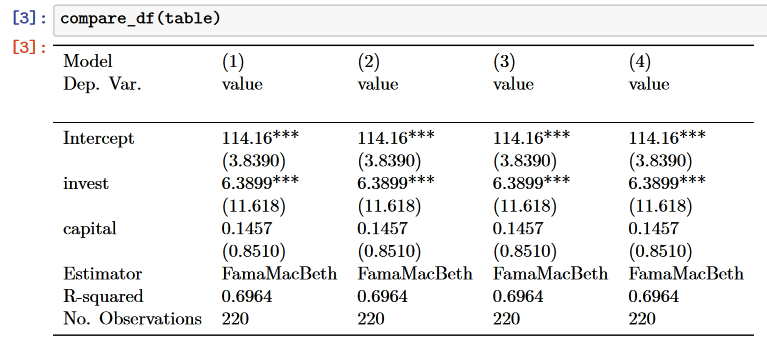
注意,此解决方案需要pd.options.display.latex.repr = True。
https://stackoverflow.com/questions/70586193
复制相似问题
腾讯云开发者

Copyright © 2013 - 2026 Tencent Cloud. All Rights Reserved. 腾讯云 版权所有
深圳市腾讯计算机系统有限公司 ICP备案/许可证号:粤B2-20090059 ![]() 粤公网安备44030502008569号
粤公网安备44030502008569号
腾讯云计算(北京)有限责任公司 京ICP证150476号 | 京ICP备11018762号