
训练,调优,交叉验证和测试游侠(随机森林)分位数回归模型?
训练,调优,交叉验证和测试游侠(随机森林)分位数回归模型?
提问于 2022-01-04 18:43:00
有人可以分享如何训练,调优(超参数),交叉验证,并测试一个游侠分位数回归模型,以及误差评估?有虹膜或者波士顿的房产数据吗?
我之所以问这个问题,是因为我没有在Kaggle,随机博客,Youtube上找到很多使用分位数回归的例子或演练。我遇到的大多数问题都是分类问题。
我目前正在使用分位数回归模型,但我希望看到其他例子,特别是在超参数调优方面。
回答 1
Stack Overflow用户
回答已采纳
发布于 2022-01-05 01:32:31
这个函数有很多参数。因为这不是一个论坛,这一切意味着什么,我真的建议你点击交叉验证的问题,如何和为什么。(或者寻找可能已经回答的问题。)
library(tidyverse)
library(ranger)
library(caret)
library(funModeling)

data(iris)

#----------- setup data -----------
# this doesn't include exploration or cleaning which are both necessary
summary(iris)
df_status(iris)

#----------------- create training sample ----------------
set.seed(395280469) # for replicability

# create training sample partition (70/20 split)
tr <- createDataPartition(iris$Species,
                          p = .8,
list = F)有很多方法来分割数据,但我倾向于使用Caret,因为如果您需要这样做的话,它们就可以消除各种因素。
#--------- First model ---------
fit.r <- ranger(Sepal.Length ~ .,
                data = iris[tr, ],
                write.forest = TRUE,
                importance = 'permutation',
                quantreg = TRUE,
                keep.inbag = TRUE,
                replace = FALSE)
fit.r
# Ranger result
#
# Call:
#  ranger(Sepal.Length ~ ., data = iris[tr, ], write.forest = TRUE,
#     importance = "permutation", quantreg = TRUE, keep.inbag = TRUE,
#     replace = FALSE)
#
# Type:                             Regression
# Number of trees:                  500
# Sample size:                      120
# Number of independent variables:  4
# Mtry:                             2
# Target node size:                 5
# Variable importance mode:         permutation
# Splitrule:                        variance
# OOB prediction error (MSE):       0.1199364
# R squared (OOB):                  0.8336928

p.r <- predict(fit.r, iris[-tr, -1],
               type = 'quantiles')
它默认为.1、.5和.9:
postResample(p.r$predictions[, 1], iris[-tr, 1])
# RMSE Rsquared MAE
# 0.5165946 0.7659124 0.4036667
postResample(p.r$predictions[, 2], iris[-tr, 1])
# RMSE Rsquared MAE
# 0.3750556 0.7587326 0.3133333
postResample(p.r$predictions[, 3], iris[-tr, 1])
# RMSE Rsquared MAE
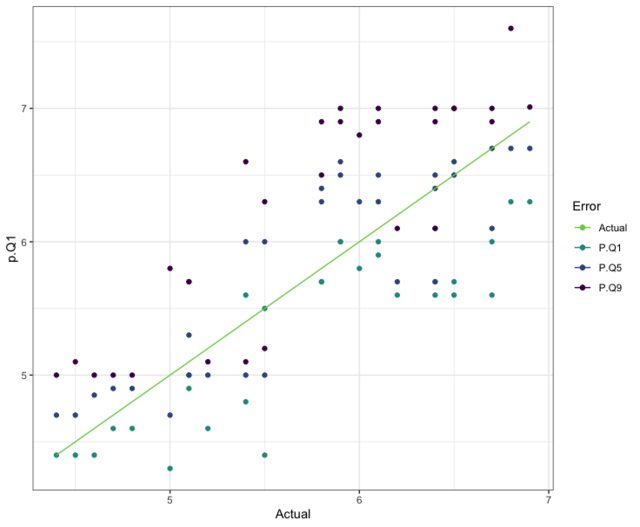
# 0.6488991 0.7461830 0.5703333 要了解这在实践中的样子:
# this performance is the best so far, let's see what it looks like visually
ggplot(data.frame(p.Q1 = p.r$predictions[, 1],
                  p.Q5 = p.r$predictions[, 2],
                  p.Q9 = p.r$predictions[, 3],
                  Actual = iris[-tr, 1])) +
  geom_point(aes(x = Actual, y = p.Q1, color = "P.Q1")) +
  geom_point(aes(x = Actual, y = p.Q5, color = "P.Q5")) +
  geom_point(aes(x = Actual, y = p.Q9, color = "P.Q9")) +
  geom_line(aes(Actual, Actual, color = "Actual")) +
  scale_color_viridis_d(end = .8, "Error",
                        direction = -1)+
  theme_bw()
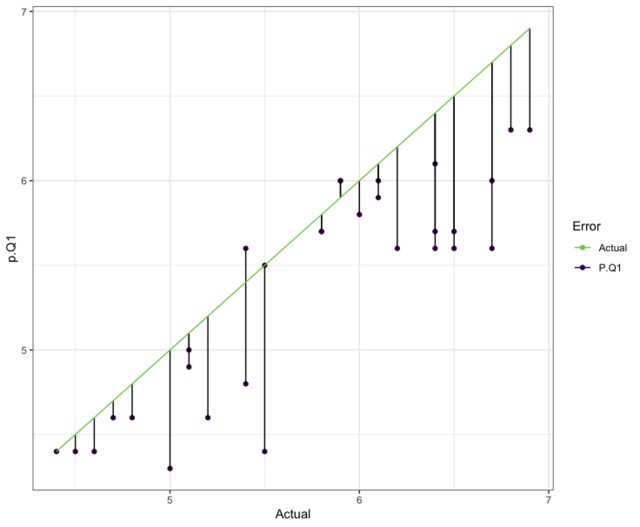
# since Quantile .1 performed the best
ggplot(data.frame(p.Q9 = p.r$predictions[, 3],
                  Actual = iris[-tr, 1])) +
  geom_point(aes(x = Actual, y = p.Q9, color = "P.Q9")) +
  geom_segment(aes(x = Actual, xend = Actual,
                   y = Actual, yend = p.Q9)) +
  geom_line(aes(Actual, Actual, color = "Actual")) +
  scale_color_viridis_d(end = .8, "Error",
                        direction = -1)+
  theme_bw()
#------------ ranger model with options --------------
# last call used default
#    splitrule: variance, use "extratrees" (only 2 for this one)
#    mtry = 2, use 3 this time
#    min.node.size = 5, using 6 this time
#    using num.threads = 15 ** this is the number of cores on YOUR device
#        change accordingly --- if you don't know, drop this one

set.seed(326)
fit.r2 <- ranger(Sepal.Length ~ .,
                data = iris[tr, ],
                write.forest = TRUE,
                importance = 'permutation',
                quantreg = TRUE,
                keep.inbag = TRUE,
                replace = FALSE,
                splitrule = "extratrees",
                mtry = 3,
                min.node.size = 6,
                num.threads = 15)
fit.r2
# Ranger result
# Type:                             Regression
# Number of trees:                  500
# Sample size:                      120
# Number of independent variables:  4
# Mtry:                             3
# Target node size:                 6
# Variable importance mode:         permutation
# Splitrule:                        extratrees
# Number of random splits:          1
# OOB prediction error (MSE):       0.1107299
# R squared (OOB):                  0.8464588
这种模式也产生了类似的结果。
p.r2 <- predict(fit.r2, iris[-tr, -1],
               type = 'quantiles')

postResample(p.r2$predictions[, 1], iris[-tr, 1])
#      RMSE  Rsquared       MAE
# 0.4932883 0.8144309 0.4000000

postResample(p.r2$predictions[, 2], iris[-tr, 1])
#      RMSE  Rsquared       MAE
# 0.3610171 0.7643744 0.3100000

postResample(p.r2$predictions[, 3], iris[-tr, 1])
#      RMSE  Rsquared       MAE
# 0.6555939 0.8141144 0.5603333
总体上来说,这一预测也相当相似。这不是一组非常大的数据,没有几个预测器。他们贡献了多少?
importance(fit.r2)
#  Sepal.Width Petal.Length  Petal.Width      Species
#   0.06138883   0.71052453   0.22956522   0.18082998

#------------ ranger model with options --------------
# drop a predictor, lower mtry, min.node.size
set.seed(326)
fit.r3 <- ranger(Sepal.Length ~ .,
                 data = iris[tr, -4], # dropped Sepal.Width
                 write.forest = TRUE,
                 importance = 'permutation',
                 quantreg = TRUE,
                 keep.inbag = TRUE,
                 replace = FALSE,
                 splitrule = "extratrees",
                 mtry = 2,            # has to change (var count lower)
                 min.node.size = 4,   # lowered
                 num.threads = 15)
fit.r3
# Ranger result
# Type:                             Regression
# Number of trees:                  500
# Sample size:                      120
# Number of independent variables:  3
# Mtry:                             2
# Target node size:                 6
# Variable importance mode:         permutation
# Splitrule:                        extratrees
# Number of random splits:          1
# OOB prediction error (MSE):       0.1050143
# R squared (OOB):                  0.8543842
第二种最重要的预测因子被移除并得到改善。
p.r3 <- predict(fit.r3, iris[-tr, -c(1, 4)],
                type = 'quantiles')

postResample(p.r3$predictions[, 1], iris[-tr, 1])
#      RMSE  Rsquared       MAE
# 0.4760952 0.8089810 0.3800000

postResample(p.r3$predictions[, 2], iris[-tr, 1])
#      RMSE  Rsquared       MAE
# 0.3738315 0.7769388 0.3250000

postResample(p.r3$predictions[, 3], iris[-tr, 1])
#      RMSE  Rsquared       MAE
# 0.6085584 0.8032592 0.5170000

importance(fit.r3)
# almost everthing relies on Petal.Length
#  Sepal.Width Petal.Length      Species
# 0.08008264 0.95440333 0.32570147 页面原文内容由Stack Overflow提供。腾讯云小微IT领域专用引擎提供翻译支持
原文链接:
https://stackoverflow.com/questions/70583626
复制相关文章
相似问题
腾讯云开发者

Copyright © 2013 - 2026 Tencent Cloud. All Rights Reserved. 腾讯云 版权所有
深圳市腾讯计算机系统有限公司 ICP备案/许可证号:粤B2-20090059 ![]() 粤公网安备44030502008569号
粤公网安备44030502008569号
腾讯云计算(北京)有限责任公司 京ICP证150476号 | 京ICP备11018762号