
Rasterio:用cmap编写浮动值的tiff
Rasterio:用cmap编写浮动值的tiff
提问于 2022-01-04 01:30:08
我有一个非常简单的代码:
import numpy as np
from rasterio.transform import Affine

nx = 5
maxx = 4.0
minx = -4.0
res = (maxx - minx) / nx
maxy = 3.0
miny = -3.0
ny = int((maxy - miny) / res)

x = np.linspace(minx, maxx, nx)
y = np.linspace(miny, maxy, ny)
z = numpy.array([
    [-1, 10, 15.1, 6.3, 50.4],
    [26.7, -1, 15.7, 40.7, 5],
    [5, -1, 9.0, 38, 40.3],
])
cmap = plt.get_cmap("nipy_spectral")
with rasterio.open(
    os.path.join(os.path.dirname(__file__), "test.tiff"),
    "w",
    driver='GTiff',
    height=z.shape[0],
    width=z.shape[1],
    count=1,
    dtype=z.dtype,
    crs='+proj=latlong',
    transform=Affine.translation(x[0]-res/2, y[0]-res/2) * Affine.scale(res, res),
    nodata=-1,
) as df:
    df.colorinterp = [ColorInterp.palette]
    # df.write_colormap(1, cmap)
    df.write(z, 1)
它在QGIS中拖放时创建一个基本图像:
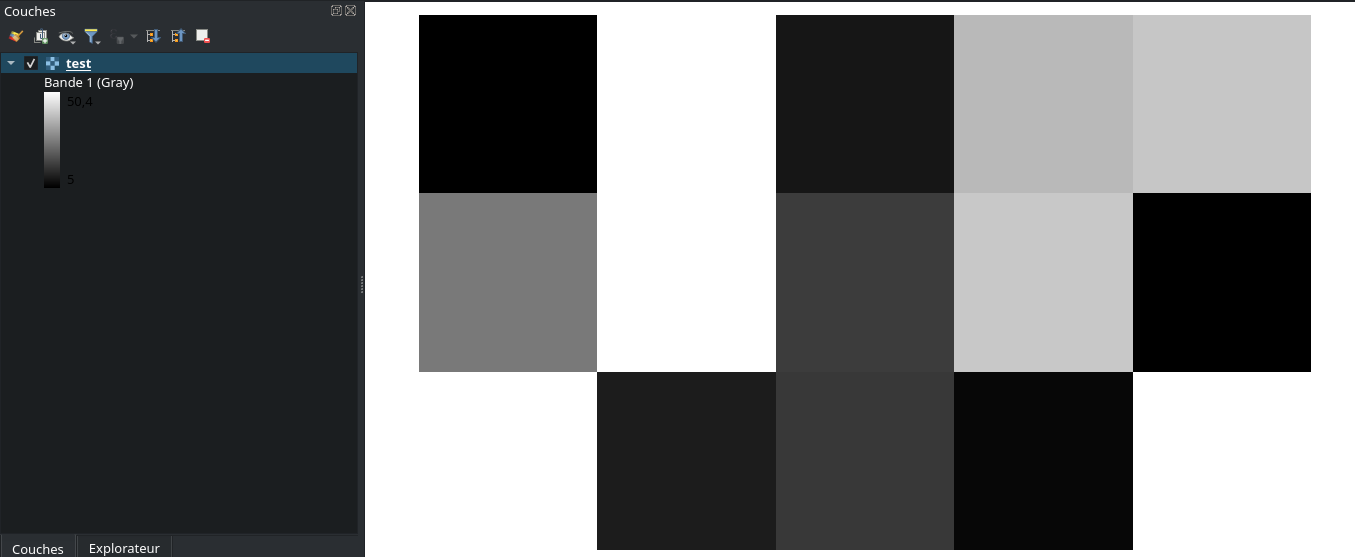
我想在Qgis中拖放这个文件,它让cmap从matplotlib中运行,名为nipy_spectral。

行# df.write_colormap(1, cmap)只适用于uint8数据(当cmap是使用int值作为键的字典时) 根据文件,但是没有关于浮点数据的文档.
我的问题和需要很简单,但文档中没有任何内容:如何在python代码中将这个cmap应用到我的df rasterio对象?
目前它正在工作,当我强制数据为uint8,但我只能有256个值,这是不够的.
。
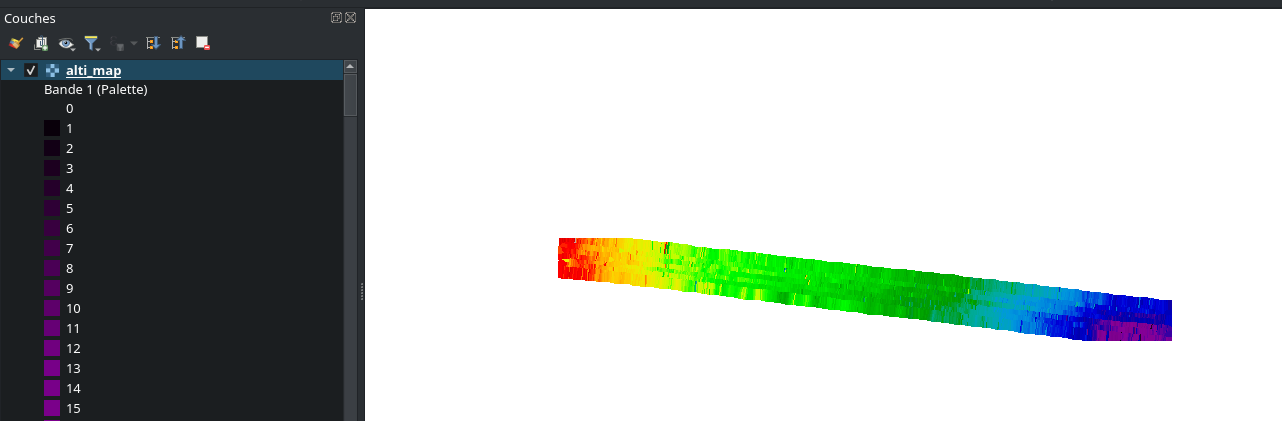
另一个解决方案是在qgis中手动添加一个预定义的cmap,如下所示:
然后可以将样式导出为文件夹。也许可以使用qgis.core python模块自动将这种样式应用于tiff文件?
回答 1
Stack Overflow用户
回答已采纳
发布于 2022-01-05 08:42:58
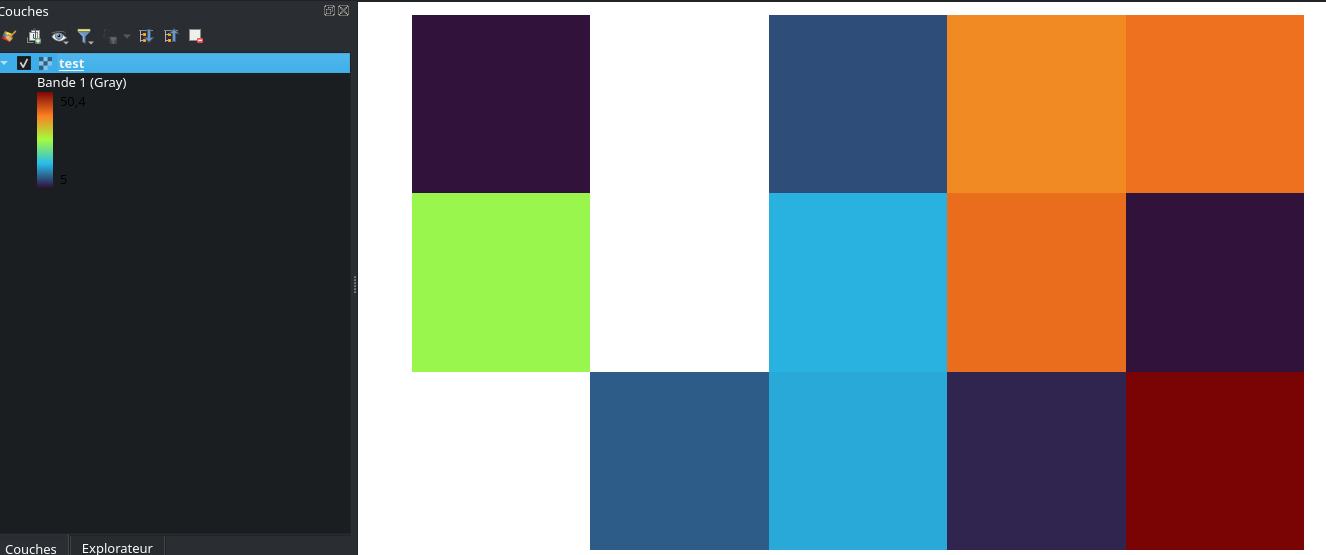
最后,我使用了以下代码行完成了这一任务:
import os
import numpy
from qgis.core import (
    QgsCoordinateReferenceSystem, QgsSingleBandPseudoColorRenderer, QgsColorRampShader, QgsStyle, QgsRasterBandStats,
    QgsRasterShader, QgsApplication, QgsProject, QgsRasterLayer)
from calcul import conversion_to_geotiff


def create_project(path_qgz, tiffs=None, epsg=2154):
    qgs = QgsApplication([], False)
    qgs.initQgis()
    project = QgsProject.instance()
    project.setTitle('test')
    project.setCrs(QgsCoordinateReferenceSystem(epsg))
    for data in tiffs:
        x, y, z, path_tif, colormap, precision = data
        conversion_to_geotiff.create_tiff(path_tif, x, y, z)
        layer = QgsRasterLayer(path_tif, os.path.splitext(os.path.basename(path_tif))[0])
        stats = layer.dataProvider().bandStatistics(1, QgsRasterBandStats.All)
        minimum = stats.minimumValue
        maximum = stats.maximumValue
        delta = maximum - minimum
        nclass = max(2, int(delta / precision))
        fractional_steps = [i / (nclass - 1) for i in range(nclass)]
        ramp = QgsStyle().defaultStyle().colorRamp(colormap)
        colors = [ramp.color(f) for f in fractional_steps]
        steps = [minimum + f * delta for f in fractional_steps]
        ramp_items = [
            QgsColorRampShader.ColorRampItem(step, color, str(step))
            for step, color in zip(steps, colors)
        ]
        shader_function = QgsColorRampShader()
        shader_function.setClassificationMode(QgsColorRampShader.EqualInterval)
        shader_function.setColorRampItemList(ramp_items)
        raster_shader = QgsRasterShader()
        raster_shader.setRasterShaderFunction(shader_function)
        renderer = QgsSingleBandPseudoColorRenderer(layer.dataProvider(), 1, raster_shader)
        layer.setRenderer(renderer)
        layer.triggerRepaint()
        project.addMapLayer(layer)
    project.write(path_qgz)
    qgs.exitQgis()


if __name__ == "__main__":
    x = np.linspace(minx, maxx, nx)
    y = np.linspace(miny, maxy, ny)
    z = numpy.array([
        [-1, 10, 15.1, 6.3, 50.4],
        [26.7, -1, 15.7, 40.7, 5],
        [5, -1, 9.0, 38, 40.3],
    ])

    create_project(
        "/home/vince/test.qgz",
        tiffs=[
            [x, y, z, "/home/vince/test.tif", "Turbo", 5]
        ]
    )
困难的部分是将qgis模块添加到您的PYTHONPATH中。它在windows中非常困难,因为有DLL,在linux中要容易得多。(只需确保您的python版本的qgis和python版本的代码是相同的。
页面原文内容由Stack Overflow提供。腾讯云小微IT领域专用引擎提供翻译支持
原文链接:
https://stackoverflow.com/questions/70573184
复制相关文章
相似问题
腾讯云开发者

Copyright © 2013 - 2026 Tencent Cloud. All Rights Reserved. 腾讯云 版权所有
深圳市腾讯计算机系统有限公司 ICP备案/许可证号:粤B2-20090059 ![]() 粤公网安备44030502008569号
粤公网安备44030502008569号
腾讯云计算(北京)有限责任公司 京ICP证150476号 | 京ICP备11018762号