
地底画不出正确的国家
地底画不出正确的国家
提问于 2022-01-03 15:32:14
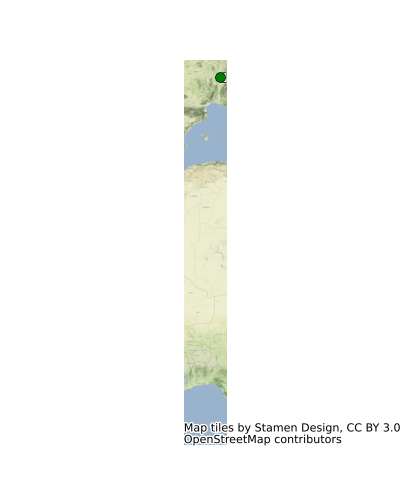
我想在法国地图上画一次旅行,但我不能只画法国地图(见图),有人能帮我吗?我相信这可能是来自上下文库的crs的一个问题,但我没有在网上找到任何信息,这里是一个可复制的例子.
import pandas as pd
import geopandas as gpd

from shapely.geometry import Point
import shapely

import matplotlib.pyplot as plt
from matplotlib.colors import to_hex
import seaborn as sns

import contextily as ctx

def main():
    gdf = pd.DataFrame()
    gdf["longitudes"] = [5.8127891, 5.2250324]
    gdf["latitudes"] = [46.1965678, 46.2051192]

    gdf["geometry"] = gpd.points_from_xy(gdf["longitudes"], gdf["latitudes"])

    gdf = gpd.GeoDataFrame(gdf, crs= {"init": "epsg:4326"})

    world = gpd.read_file(gpd.datasets.get_path('naturalearth_lowres'))

    france = world.query('name == "France"')

    # Make the plot
    fig, ax = plt.subplots(figsize=(4,5))

    #ax = gdf.plot(figsize=(10, 5))

    # Plot the state outlines
    france.boundary.plot(color='black', linewidth=0.5, ax=ax)


    # Modify projection to match what contextily uses
    gdf = gdf.to_crs(epsg=3857)

    part1 = shapely.geometry.LineString(
        gdf['geometry'].values)


    linegdf = gpd.GeoDataFrame(
    {'geometry': [part1]}
    )


    c = to_hex(sns.light_palette('green')[0])

    linegdf.plot(
        color=c,
        linewidth=3,
        ax=ax
    )

    print(len(gdf))

    # Plot points colored by day
    gdf.plot(
        cmap=sns.light_palette('green', as_cmap=True),
        ax=ax,
        markersize=50,
        edgecolor='black', linewidth=0.5,
        zorder=1000 # force the points to be the top layer of the plot
    )

    # Add basemap
    ctx.add_basemap(ax=ax)

    # Remove axes
    ax.set_axis_off()

    plt.show()

main()
任何帮助都是非常感谢的!
回答 1
Stack Overflow用户
回答已采纳
发布于 2022-01-05 09:57:27
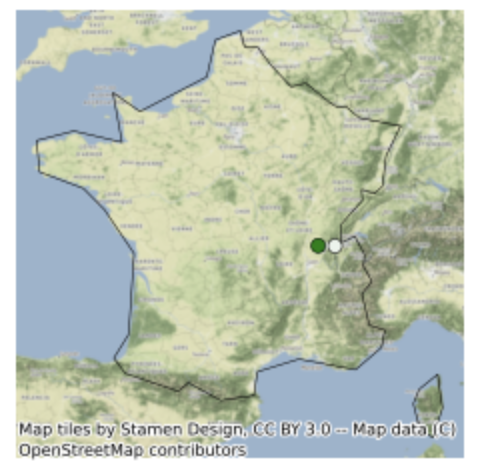
两点
法国
- 是一个MutliPolygon,它的一部分位于南极洲。将此排除在几何学之外,
- 需要与CRS非常一致。另外,最好不要将遗留文件用于引用CRS
{"init": "epsg:4326"}
。
import matplotlib.pyplot as plt
from matplotlib.colors import to_hex
import seaborn as sns
import pandas as pd
import geopandas as gpd
import shapely.geometry
import contextily as ctx


def main():
    gdf = pd.DataFrame()
    gdf["longitudes"] = [5.8127891, 5.2250324]
    gdf["latitudes"] = [46.1965678, 46.2051192]

    gdf["geometry"] = gpd.points_from_xy(gdf["longitudes"], gdf["latitudes"])

    # lets project CRS early...
    gdf = gpd.GeoDataFrame(gdf, crs="epsg:4326").to_crs("EPSG:3857")

    world = gpd.read_file(gpd.datasets.get_path("naturalearth_lowres"))

    france = world.query('name == "France"')
    # just mainland france, not antartica... plus CRS
    france = (
        france["geometry"]
        .apply(
            lambda mp: shapely.geometry.MultiPolygon(
                [p for p in mp.geoms if p.bounds[1] > 20]
            )
        )
        .to_crs("EPSG:3857")
    )

    # Make the plot
    fig, ax = plt.subplots(figsize=(4, 5))

    # Plot the state outlines
    ax = france.boundary.plot(color="black", linewidth=0.5, ax=ax)

    part1 = shapely.geometry.LineString(gdf["geometry"].values)

    linegdf = gpd.GeoDataFrame({"geometry": [part1]})

    c = to_hex(sns.light_palette("green")[0])

    linegdf.plot(color=c, linewidth=3, ax=ax)

    # Plot points colored by day
    gdf.plot(
        cmap=sns.light_palette("green", as_cmap=True),
        ax=ax,
        markersize=50,
        edgecolor="black",
        linewidth=0.5,
        zorder=1000,  # force the points to be the top layer of the plot
    )

    # Add basemap
    ctx.add_basemap(ax=ax)

    # Remove axes
    ax.set_axis_off()

    plt.show()


main()
页面原文内容由Stack Overflow提供。腾讯云小微IT领域专用引擎提供翻译支持
原文链接:
https://stackoverflow.com/questions/70568019
复制相关文章
相似问题
腾讯云开发者

Copyright © 2013 - 2026 Tencent Cloud. All Rights Reserved. 腾讯云 版权所有
深圳市腾讯计算机系统有限公司 ICP备案/许可证号:粤B2-20090059 ![]() 粤公网安备44030502008569号
粤公网安备44030502008569号
腾讯云计算(北京)有限责任公司 京ICP证150476号 | 京ICP备11018762号