
在正方形网格中创建一个圆
在正方形网格中创建一个圆
提问于 2021-12-29 08:30:17
我试图通过固定平行板电容器程序来解决以下二维椭圆型PDE静电问题。但我有问题来绘制圆圈区域。我怎样才能画出圆形区域而不是正方形呢?
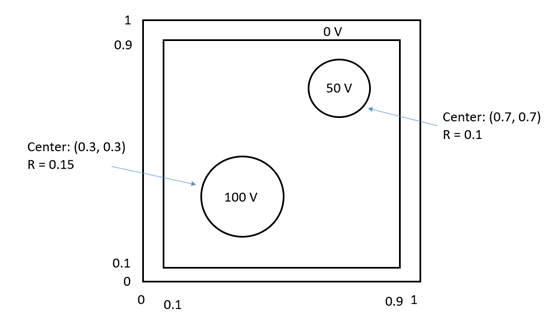
% I use following two lines to label the 50V and 100V squares
% (but it should be two circles)
V(pp1-r_circle_small:pp1+r_circle_small,pp1-r_circle_small:pp1+r_circle_small) = 50;
V(pp2-r_circle_big:pp2+r_circle_big,pp2-r_circle_big:pp2+r_circle_big) = 100;
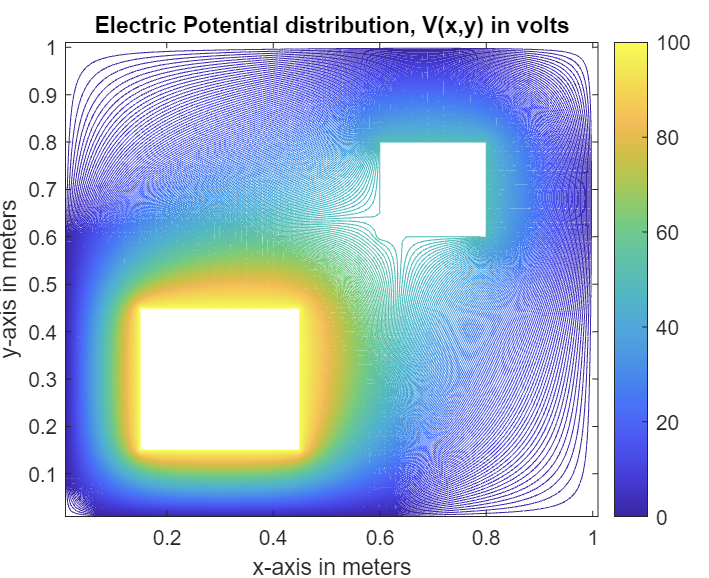
% Contour Display for electric potential
figure(1)
contour_range_V = -101:0.5:101;
contour(x,y,V,contour_range_V,'linewidth',0.5);
axis([min(x) max(x) min(y) max(y)]);
colorbar('location','eastoutside','fontsize',10);
xlabel('x-axis in meters','fontsize',10);
ylabel('y-axis in meters','fontsize',10);
title('Electric Potential distribution, V(x,y) in volts','fontsize',14);
h1=gca;
set(h1,'fontsize',10);
fh1 = figure(1);
set(fh1, 'color', 'white')
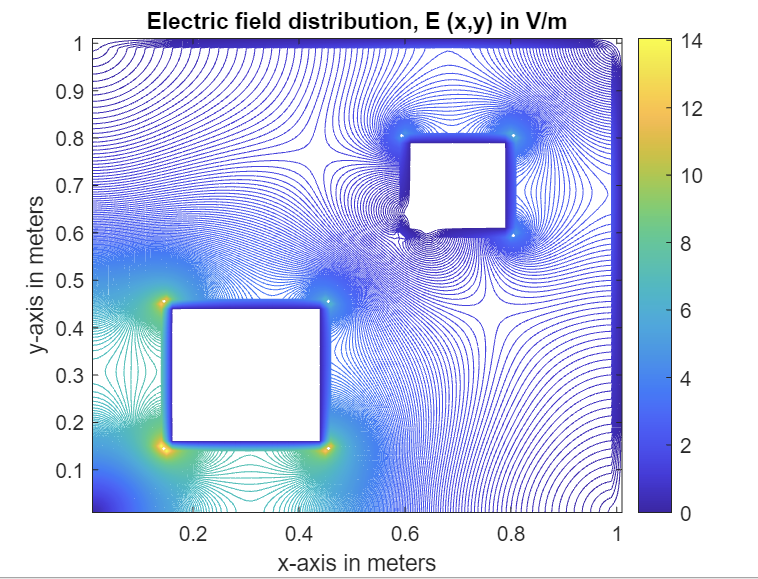
% Contour Display for electric field
figure(2)
contour_range_E = -20:0.05:20;
contour(x,y,E,contour_range_E,'linewidth',0.5);
axis([min(x) max(x) min(y) max(y)]);
colorbar('location','eastoutside','fontsize',10);
xlabel('x-axis in meters','fontsize',10);
ylabel('y-axis in meters','fontsize',10);
title('Electric field distribution, E (x,y) in V/m','fontsize',14);
h2=gca;
set(h2,'fontsize',10);
fh2 = figure(2);
set(fh2, 'color', 'white')
回答 1
Stack Overflow用户
发布于 2021-12-29 09:24:56
由于索引的方式,您正在创建一个正方形(请参阅this post on indexing)。您已经指定了从pp1-r_circle_small到pp1+r_circle_small运行的行,并为列指定了类似的行。考虑到这个Swiss cheese is not an option,您正在创建一个完整的正方形。
从几何上我们知道,从sqrt((X-X0)^2 - (Y-Y0)^2) < R到(X0,Y0)圆心的距离内的所有点(半径为R )都在圆内,其余点在圆周之外。这意味着您可以简单地构建一个掩码:
% Set up your grid
Xsize = 30; % Your case: 1
Ysize = 30; % Your case: 1
step = 1; % Amount of gridpoints; use 0.001 or something
% Build indexing grid for circle search, adapt as necessary
X = 0:step:Xsize;
Y = 0:step:Ysize;
[XX,YY] = meshgrid(X, Y);
V = zeros(numel(X), numel(Y));
% Repeat the below for both circles
R = 10; % Radius of your circle; your case 0.1 and 0.15
X0 = 11; % X coordinate of the circle's origin; your case 0.3 and 0.7
Y0 = 15; % Y coordinate of the circle's origin; your case 0.3 and 0.7
% Logical check to see whether a point is inside or outside
mask = sqrt( (XX - X0).^2 + (YY - Y0).^2) < R;
V(mask) = 50; % Give your circle the desired value
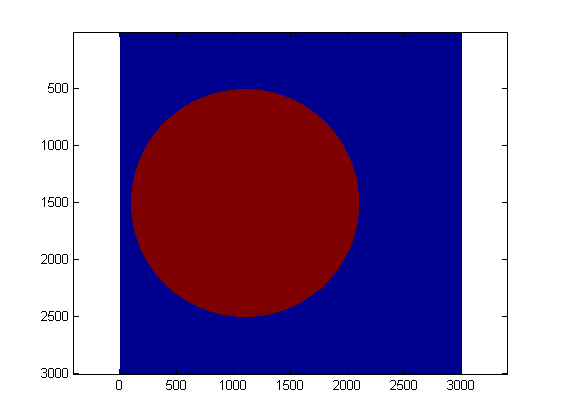
imagesc(V) % Just to show you the result
axis equal % Use equal axis to have no image distortionmask是一个逻辑矩阵,包含1 (点在圆圈内)和0 (点在外部)。然后,可以使用此掩码对潜在的网格V进行逻辑索引,以将其设置为所需的值。
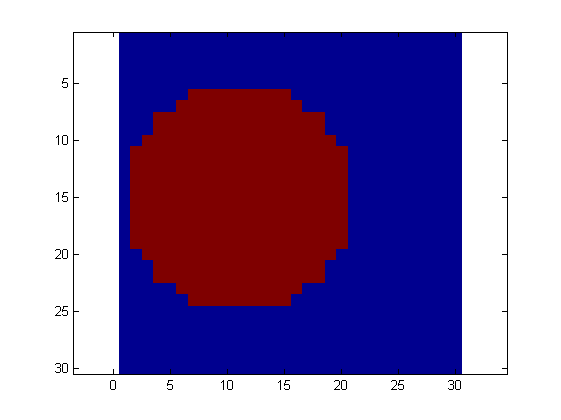
注意:这显然不会创建一个完美的圆,因为你不能在正方形网格上绘制一个完美的圆。网格越细,就越像你的“圆圈”。这显示了使用step = 0.01的结果
注2:您需要对X、Y、X0、Y0和R的定义进行一周的调整,以匹配您的值。
页面原文内容由Stack Overflow提供。腾讯云小微IT领域专用引擎提供翻译支持
原文链接:
https://stackoverflow.com/questions/70516915
复制相关文章
相似问题
腾讯云开发者

Copyright © 2013 - 2026 Tencent Cloud. All Rights Reserved. 腾讯云 版权所有
深圳市腾讯计算机系统有限公司 ICP备案/许可证号:粤B2-20090059 ![]() 粤公网安备44030502008569号
粤公网安备44030502008569号
腾讯云计算(北京)有限责任公司 京ICP证150476号 | 京ICP备11018762号