
如何从市场开放中获得高、低1小时和2小时的蜡烛?
如何从市场开放中获得高、低1小时和2小时的蜡烛?
提问于 2021-12-24 16:11:14
从市场开放的头1小时和2小时蜡烛的高值和低值。我看不出有什么直接的方法把时间框架传递给高和低的功能。我想要画出中间价,所以需要这些价值来做我想要达到的目标。
回答 1
Stack Overflow用户
回答已采纳
发布于 2021-12-27 14:02:44
我这样做的方式是,
将当前时间框架转换为分钟。然后计算出在你的图表上一小时零两个小时内有多少个酒吧。为此设置两个计数器,并在计数器处于限制范围内时更新高/低变量。
//@version=5
indicator("My Script", overlay=true)

// ————— Converts current chart timeframe into a float minutes value.
f_resInMinutes() =>
    _resInMinutes = timeframe.multiplier * (
      timeframe.isseconds ? 1. / 60             :
      timeframe.isminutes ? 1.                  :
      timeframe.isdaily   ? 60. * 24            :
      timeframe.isweekly  ? 60. * 24 * 7        :
      timeframe.ismonthly ? 60. * 24 * 30.4375  : na)

var high_1h = 10e-10
var low_1h = 10e10
var high_2h = 10e-10
var low_2h = 10e10

bars_1h = 60 / f_resInMinutes()     // Number of bars within an hour
bars_2h = 120 / f_resInMinutes()    // Number of bars within two hours

var cnt_1h = 0
var cnt_2h = 0

isNewMarketOpen = session.ispremarket[1] and session.ismarket

cnt_1h := isNewMarketOpen ? 0 : cnt_1h + 1  // Reset when market opens, increase otherwise
cnt_2h := isNewMarketOpen ? 0 : cnt_2h + 1  // Reset when market opens, increase otherwise

high_1h := isNewMarketOpen ? 10e-10 : high_1h
low_1h := isNewMarketOpen ? 10e10 : low_1h
high_2h := isNewMarketOpen ? 10e-10 : high_2h
low_2h := isNewMarketOpen ? 10e10 : low_2h

if (cnt_1h <= bars_1h)
    high_1h := high > high_1h ? high : high_1h
    low_1h := low < low_1h ? low : low_1h

if (cnt_2h <= bars_2h)
    high_2h := high > high_2h ? high : high_2h
    low_2h := low < low_2h ? low : low_2h

plot(high_1h, color=color.green)
plot(low_1h, color=color.red)
plot(high_2h, color=color.purple)
plot(low_2h, color=color.orange)
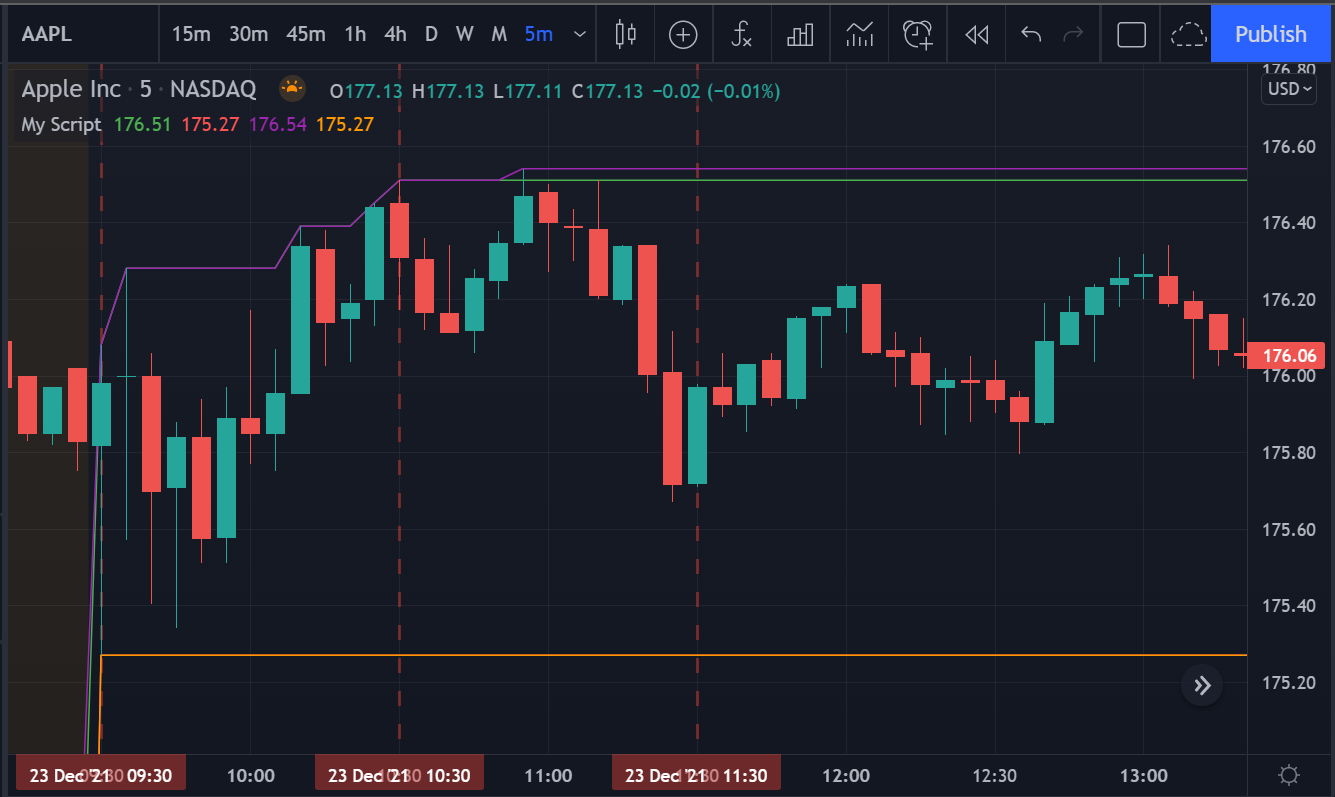
市场在09:30开盘。这是最低的时间是1小时和2小时。然后在10:30,正好在市场开盘一小时后,价格再创新高。该值在会话的其余部分保持为1小时高(绿行)。对于2小时高,你可以跟随紫色线。
页面原文内容由Stack Overflow提供。腾讯云小微IT领域专用引擎提供翻译支持
原文链接:
https://stackoverflow.com/questions/70474755
复制相关文章
相似问题
腾讯云开发者

Copyright © 2013 - 2026 Tencent Cloud. All Rights Reserved. 腾讯云 版权所有
深圳市腾讯计算机系统有限公司 ICP备案/许可证号:粤B2-20090059 ![]() 粤公网安备44030502008569号
粤公网安备44030502008569号
腾讯云计算(北京)有限责任公司 京ICP证150476号 | 京ICP备11018762号