
用rails和stimulusJS运行Chart.js示例
用rails和stimulusJS运行Chart.js示例
提问于 2021-12-22 21:42:41
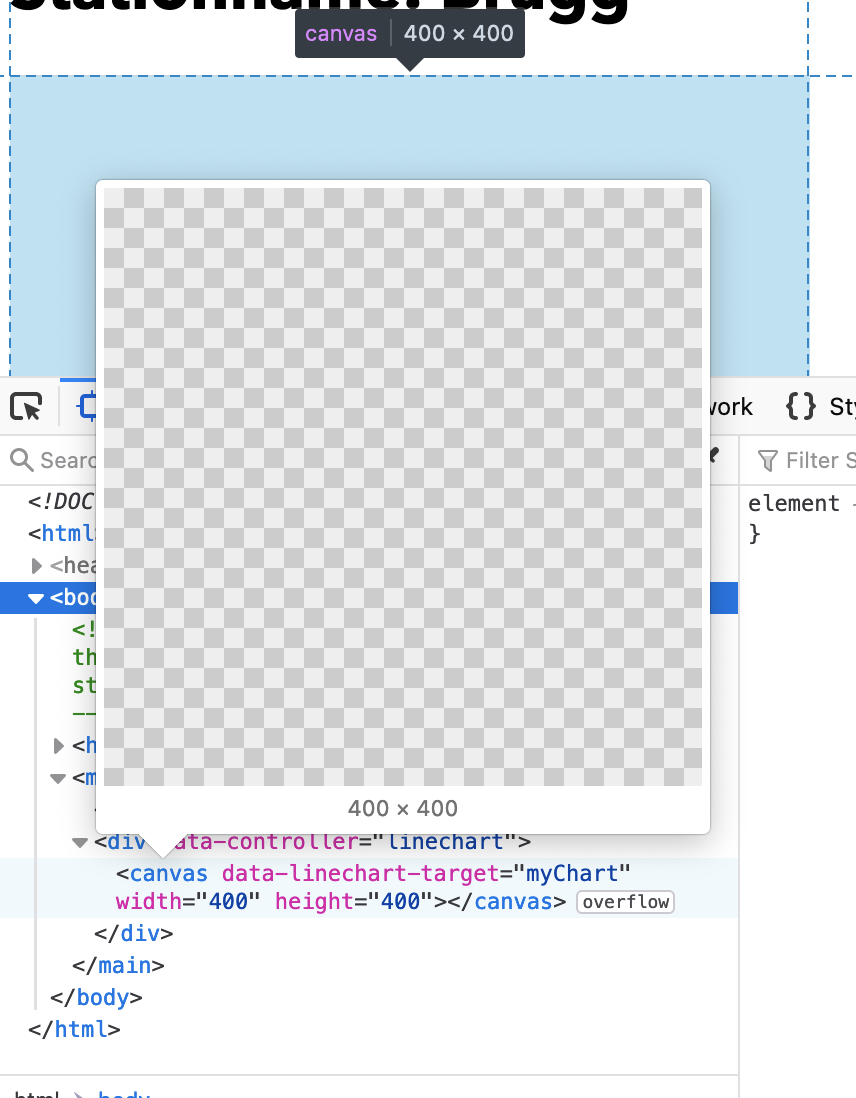
我想使用Chart.js在Rails中使用StimulusJS运行第一个示例。但出于某种原因,它只是呈现一个空画布(请参见[3.])。
这是html:
<div data-controller="linechart">
  <canvas data-linechart-target="myChart" width="400" height="400"></canvas>
</div>
这是我的刺激控制器:
import {Controller} from "@hotwired/stimulus"
import Chart from 'https://cdn.skypack.dev/chartjs';

export default class extends Controller {
    static targets = ['myChart'];

    canvasContext() {
        return this.myChartTarget.getContext('2d');
    }

    connect() {
        new Chart(this.canvasContext(), {
            type: 'bar',
            data: {
                labels: ['Red', 'Blue', 'Yellow', 'Green', 'Purple', 'Orange'],
                datasets: [{
                    label: '# of Votes',
                    data: [12, 19, 3, 5, 2, 3],
                    backgroundColor: [
                        'rgba(255, 99, 132, 0.2)',
                        'rgba(54, 162, 235, 0.2)',
                        'rgba(255, 206, 86, 0.2)',
                        'rgba(75, 192, 192, 0.2)',
                        'rgba(153, 102, 255, 0.2)',
                        'rgba(255, 159, 64, 0.2)'
                    ],
                    borderColor: [
                        'rgba(255, 99, 132, 1)',
                        'rgba(54, 162, 235, 1)',
                        'rgba(255, 206, 86, 1)',
                        'rgba(75, 192, 192, 1)',
                        'rgba(153, 102, 255, 1)',
                        'rgba(255, 159, 64, 1)'
                    ],
                    borderWidth: 1
                }]
            },
            options: {
                scales: {
                    y: {
                        beginAtZero: true
                    }
                }
            }
        });
    }
}
我遗漏了什么?
回答 1
Stack Overflow用户
回答已采纳
发布于 2021-12-26 22:11:32
- 我认为您没有导入正确的库。网址应为
'https://cdn.skypack.dev/chart.js' - 进口和登记: 从'https://cdn.skypack.dev/chart.js';Chart.register(...registerables)导入{图表、寄存器};
页面原文内容由Stack Overflow提供。腾讯云小微IT领域专用引擎提供翻译支持
原文链接:
https://stackoverflow.com/questions/70455432
复制相关文章
相似问题
腾讯云开发者

Copyright © 2013 - 2026 Tencent Cloud. All Rights Reserved. 腾讯云 版权所有
深圳市腾讯计算机系统有限公司 ICP备案/许可证号:粤B2-20090059 ![]() 粤公网安备44030502008569号
粤公网安备44030502008569号
腾讯云计算(北京)有限责任公司 京ICP证150476号 | 京ICP备11018762号