
SHAP: XGBoost和LightGBM在shap_values计算中的差异
我在代码中有以下代码:
import pandas as pd
import numpy as np
import shap
import matplotlib.pyplot as plt
import xgboost as xgb
from sklearn.model_selection import train_test_split, StratifiedKFold, cross_validate, cross_val_score
from sklearn.metrics import classification_report, ConfusionMatrixDisplay, accuracy_score

df = pd.read_csv("./mydataset.csv")
target=df.pop('target')
X_train, X_test, y_train, y_test = train_test_split(df, target, test_size=0.2, random_state=22)
X_train, X_val, y_train, y_val = train_test_split(X_train, y_train, test_size=0.2, random_state=22)

xgb_model = xgb.XGBClassifier(eval_metric='mlogloss',use_label_encoder =False)
xgb_fitted = xgb_model.fit(X_train, y_train)

explainer = shap.TreeExplainer(xgb_fitted)
shap_values = explainer.shap_values(X_test)

shap.summary_plot(shap_values[1], X_test)
shap.summary_plot(shap_values[1], X_test, plot_type="bar")
当我运行这段代码时,我会得到以下错误:
Summary plots need a matrix of shap_values, not a vector.在shap.summary_plot线路上。
问题是什么,我如何解决?
上面的代码基于以下代码示例:https://github.com/slundberg/shap。
数据集如下:
Cat1,Cat2,Age,Cat3,Cat4,target
0,0,18,1,0,1
0,0,17,1,0,1
0,0,15,1,1,1
0,0,15,1,0,1
0,0,16,1,0,1
0,1,16,1,1,1
0,1,16,1,1,1
0,0,17,1,0,1
0,1,15,1,1,1
0,1,15,1,0,1
0,0,15,1,0,1
0,0,15,1,0,1
0,1,15,1,1,1
0,1,15,1,0,1
0,1,15,1,0,1
0,0,16,1,0,1
0,0,16,1,0,1
0,0,16,1,0,1
0,1,17,1,0,0
0,1,16,1,1,1
0,1,15,1,0,1
0,1,15,1,0,1
0,1,16,1,1,1
0,1,16,1,1,1
0,0,15,0,0,1
0,0,16,1,0,1
0,1,15,1,0,1
请注意,实际数据有700行,但我复制了其中的一小部分,只是为了显示数据的外观。
编辑1
这个问题的主要原因是了解在使用不同的分类器时应该如何更改代码。
我最初有一个使用lgmb的示例代码,但当我将它更改为xgboost时,它会在摘要图上生成错误。
为了说明我的意思,我开发了以下示例代码:
import pandas as pd
import shap
import lightgbm as lgb
import xgboost as xgb
from sklearn.model_selection import train_test_split

df = pd.read_csv("./mydataset.csv")
target=df.pop('target')
X_train, X_test, y_train, y_test = train_test_split(df, target, test_size=0.2, random_state=22)

# select one of the two models
model = xgb.XGBClassifier()
#model = lgb.LGBMClassifier()
model_fitted = model.fit(X_train, y_train)

explainer = shap.Explainer(model_fitted)
shap_values = explainer.shap_values(X_test)

shap.summary_plot(shap_values[1], X_test)
shap.summary_plot(shap_values[1], X_test, plot_type="bar")
如果我使用LGBM模型,它运行良好,如果我使用XGBoost,它就失败了。有什么区别,我应该如何更改代码,XGBoost的行为类似于LGBM和应用程序工作。
回答 2
Stack Overflow用户
发布于 2021-12-23 15:28:33
注意,使用summary_plot(),您希望可视化哪些特性对模型更重要,因此它需要一个矩阵。
对于单个输出解释,这是SHAP值的矩阵(# samples #功能)。
shap_values = explainer.shap_values(X_test)的结果是形状(n_samples, 5) (样本数据中的列)的矩阵。
当您使用第一个示例时,shap_values[0]是解释第一个预测特性贡献的向量,这就是Summary plots need a matrix of shap_values, not a vector.引发的原因。
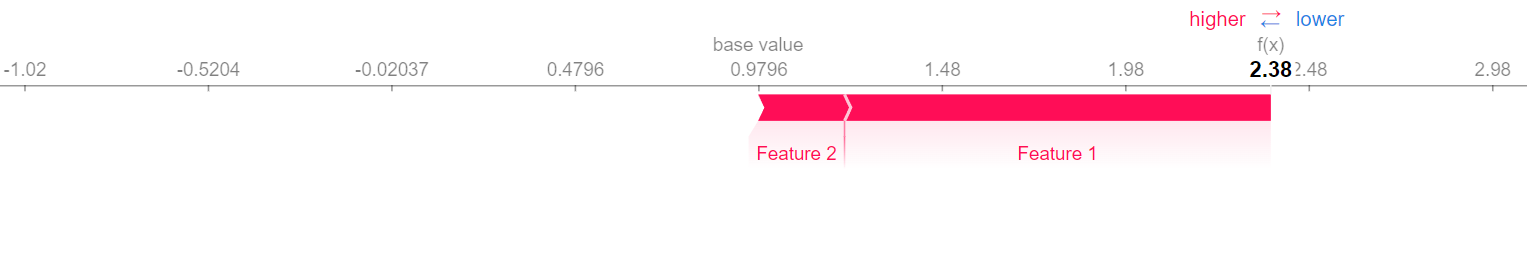
如果您想要可视化单个预测shap_values[0],您可以使用绘图
shap.initjs()
shap.force_plot(explainer.expected_value, shap_values[0])
编辑
这两个模型的输出之间的差异在于如何计算out结果。检查lightgbm计算的源代码,一旦计算了变量phi,它将以下列方式进行连接值
phi = np.concatenate((0-phi, phi), axis=-1)生成形状(n_samples, n_features*2)的数组。
这个形状不同于X_test,也就是phi.shape[1] != X.shape[1] + 1,所以它是二维数组的重塑它。
phi = phi.reshape(X.shape[0], phi.shape[1]//(X.shape[1]+1), X.shape[1]+1)最后,输出是一个长度2的列表
out = [phi[:, i, :-1] for i in range(phi.shape[1])]
out
>>>
[array([[0., 0., 0., 0., 0.],
        [0., 0., 0., 0., 0.],
        ...
        [0., 0., 0., 0., 0.],
        [0., 0., 0., 0., 0.]]),
 array([[0., 0., 0., 0., 0.],
        [0., 0., 0., 0., 0.],
        [0., 0., 0., 0., 0.],
        ...
        [0., 0., 0., 0., 0.],
[0., 0., 0., 0., 0.]])]请参阅下面的示例,了解out计算的不同之处。
使用LightGBM的示例
import pandas as pd
import numpy as np
import shap
import lightgbm as lgb
import xgboost as xgb
import shap.explainers as explainers
from sklearn.model_selection import train_test_split

df = pd.read_csv("test_data.csv")
target=df.pop('target')

X_train, X_test, y_train, y_test = train_test_split(df, target, test_size=0.5, random_state=0)

model = lgb.LGBMClassifier()
model_fitted = model.fit(X_train, y_train)
explainer = shap.TreeExplainer(model_fitted)

# Calculate phi from https://github.com/slundberg/shap/blob/46b3800b31df04745416da27c71b216f91d61775/shap/explainers/_tree.py#L347
tree_limit = -1 if explainer.model.tree_limit is None else explainer.model.tree_limit
phi = explainer.model.original_model.predict(X_test, num_iteration=tree_limit, pred_contrib=True)

# Objective is binary: https://github.com/slundberg/shap/blob/46b3800b31df04745416da27c71b216f91d61775/shap/explainers/_tree.py#L349
if explainer.model.original_model.params['objective'] == 'binary':
    phi = np.concatenate((0-phi, phi), axis=-1)

# Phi shape is different from X_test:
if phi.shape[1] != X_test.shape[1] + 1:
    phi = phi.reshape(X_test.shape[0], phi.shape[1]//(X_test.shape[1]+1), X_test.shape[1]+1)

# Return out: https://github.com/slundberg/shap/blob/46b3800b31df04745416da27c71b216f91d61775/shap/explainers/_tree.py#L370
expected_value = [phi[0, i, -1] for i in range(phi.shape[1])]
out = [phi[:, i, :-1] for i in range(phi.shape[1])]
expected_value
>>> [-0.8109302162163288, 0.8109302162163288]
out
>>>
[array([[0., 0., 0., 0., 0.],
        [0., 0., 0., 0., 0.],
        [0., 0., 0., 0., 0.],
        [0., 0., 0., 0., 0.],
        [0., 0., 0., 0., 0.],
        [0., 0., 0., 0., 0.],
        [0., 0., 0., 0., 0.],
        [0., 0., 0., 0., 0.],
        [0., 0., 0., 0., 0.],
        [0., 0., 0., 0., 0.],
        [0., 0., 0., 0., 0.],
        [0., 0., 0., 0., 0.],
        [0., 0., 0., 0., 0.],
        [0., 0., 0., 0., 0.]]),
 array([[0., 0., 0., 0., 0.],
        [0., 0., 0., 0., 0.],
        [0., 0., 0., 0., 0.],
        [0., 0., 0., 0., 0.],
        [0., 0., 0., 0., 0.],
        [0., 0., 0., 0., 0.],
        [0., 0., 0., 0., 0.],
        [0., 0., 0., 0., 0.],
        [0., 0., 0., 0., 0.],
        [0., 0., 0., 0., 0.],
        [0., 0., 0., 0., 0.],
        [0., 0., 0., 0., 0.],
        [0., 0., 0., 0., 0.],
        [0., 0., 0., 0., 0.]])]
使用XGBoost的示例
import pandas as pd
import numpy as np
import shap
import lightgbm as lgb
import xgboost as xgb
import shap.explainers as explainers
from sklearn.model_selection import train_test_split

df = pd.read_csv("test_data.csv")
target=df.pop('target')

X_train, X_test, y_train, y_test = train_test_split(df, target, test_size=0.5, random_state=0)

model = xgb.XGBClassifier()
model_fitted = model.fit(X_train, y_train)
explainer = shap.TreeExplainer(model_fitted)

# Transform data to DMatrix: https://github.com/slundberg/shap/blob/46b3800b31df04745416da27c71b216f91d61775/shap/explainers/_tree.py#L326
if not isinstance(X_test, xgb.core.DMatrix):
    X_test = xgb.DMatrix(X_test)

tree_limit = explainer.model.tree_limit

# Calculate phi: https://github.com/slundberg/shap/blob/46b3800b31df04745416da27c71b216f91d61775/shap/explainers/_tree.py#L331
phi = explainer.model.original_model.predict(
    X_test, ntree_limit=tree_limit, pred_contribs=True,
    approx_contribs=False, validate_features=False
)

# Model output is "raw": https://github.com/slundberg/shap/blob/46b3800b31df04745416da27c71b216f91d61775/shap/explainers/_tree.py#L339
model_output_vals = explainer.model.original_model.predict(
    X_test, ntree_limit=tree_limit, output_margin=True,
    validate_features=False
)
model_output_vals
>>> array([-0.11323176, -0.11323176,  0.5436669 ,  0.87637275,  1.5332711 ,
       -0.11323176,  1.5332711 ,  0.5436669 ,  1.5332711 ,  0.5436669 ,
        0.87637275,  0.87637275, -0.11323176,  0.5436669 ], dtype=float32)

# Return out: https://github.com/slundberg/shap/blob/46b3800b31df04745416da27c71b216f91d61775/shap/explainers/_tree.py#L374
expected_value_ = phi[0, -1]
expected_value_
>>> 0.817982
out_ = phi[:, :-1]
out_
>>>
array([[ 0.        , -0.35038763, -0.5808259 ,  0.        ,  0.        ],
       [ 0.        , -0.35038763, -0.5808259 ,  0.        ,  0.        ],
       [ 0.        ,  0.3065111 , -0.5808259 ,  0.        ,  0.        ],
       [ 0.        , -0.35038763,  0.4087782 ,  0.        ,  0.        ],
       [ 0.        ,  0.3065111 ,  0.4087782 ,  0.        ,  0.        ],
       [ 0.        , -0.35038763, -0.5808259 ,  0.        ,  0.        ],
       [ 0.        ,  0.3065111 ,  0.4087782 ,  0.        ,  0.        ],
       [ 0.        ,  0.3065111 , -0.5808259 ,  0.        ,  0.        ],
       [ 0.        ,  0.3065111 ,  0.4087782 ,  0.        ,  0.        ],
       [ 0.        ,  0.3065111 , -0.5808259 ,  0.        ,  0.        ],
       [ 0.        , -0.35038763,  0.4087782 ,  0.        ,  0.        ],
       [ 0.        , -0.35038763,  0.4087782 ,  0.        ,  0.        ],
       [ 0.        , -0.35038763, -0.5808259 ,  0.        ,  0.        ],
       [ 0.        ,  0.3065111 , -0.5808259 ,  0.        ,  0.        ]],
dtype=float32)Stack Overflow用户
发布于 2021-12-23 16:54:01
假设您已经复制了上述问题中的数据,则可以执行以下操作:
import pandas as pd
import numpy as np
import shap
import matplotlib.pyplot as plt
import xgboost as xgb
from sklearn.model_selection import (
    train_test_split,
    StratifiedKFold,
    cross_validate,
    cross_val_score,
)
from sklearn.metrics import (
    classification_report,
    ConfusionMatrixDisplay,
    accuracy_score,
)

df = pd.read_clipboard(sep=",")

target = df.pop("target")
X_train, X_test, y_train, y_test = train_test_split(
    df, target, test_size=0.2, random_state=42
)
X_train, X_val, y_train, y_val = train_test_split(
    X_train, y_train, test_size=0.2, random_state=42
)


xgb_model = xgb.XGBClassifier(eval_metric="mlogloss", use_label_encoder=False)
xgb_fitted = xgb_model.fit(X_train, y_train)

explainer = shap.TreeExplainer(xgb_fitted)
shap_values = explainer.shap_values(X_test)

shap.summary_plot(shap_values, X_test)
# shap.summary_plot(shap_values, X_test, plot_type="bar")
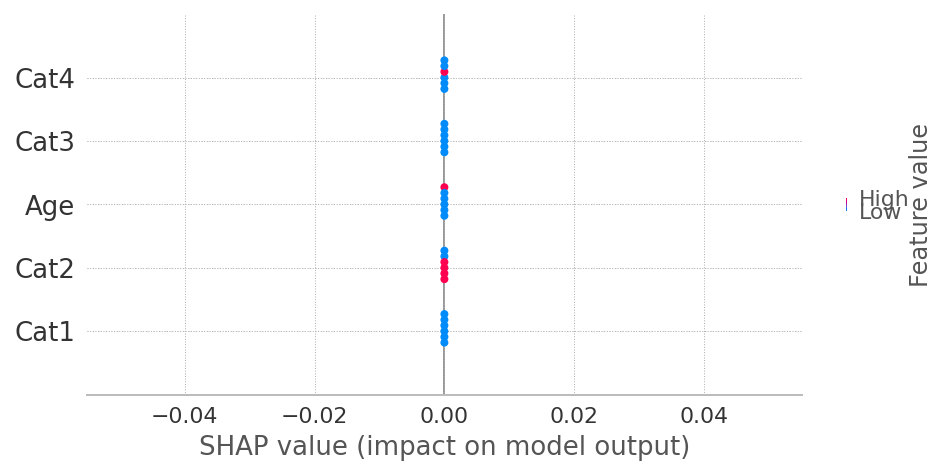
您粘贴的代码假设每个类"0“和"1”的shap值有2个“相同”的数组。自从打印后,explainer.shap_values计算XGBoost的SHAP值的方式发生了变化。因此,现在提供shap_values (没有类索引)就足够了。
https://stackoverflow.com/questions/70450755
复制相似问题
腾讯云开发者

Copyright © 2013 - 2026 Tencent Cloud. All Rights Reserved. 腾讯云 版权所有
深圳市腾讯计算机系统有限公司 ICP备案/许可证号:粤B2-20090059 ![]() 粤公网安备44030502008569号
粤公网安备44030502008569号
腾讯云计算(北京)有限责任公司 京ICP证150476号 | 京ICP备11018762号