
多量程图
多量程图
提问于 2021-12-21 06:17:57
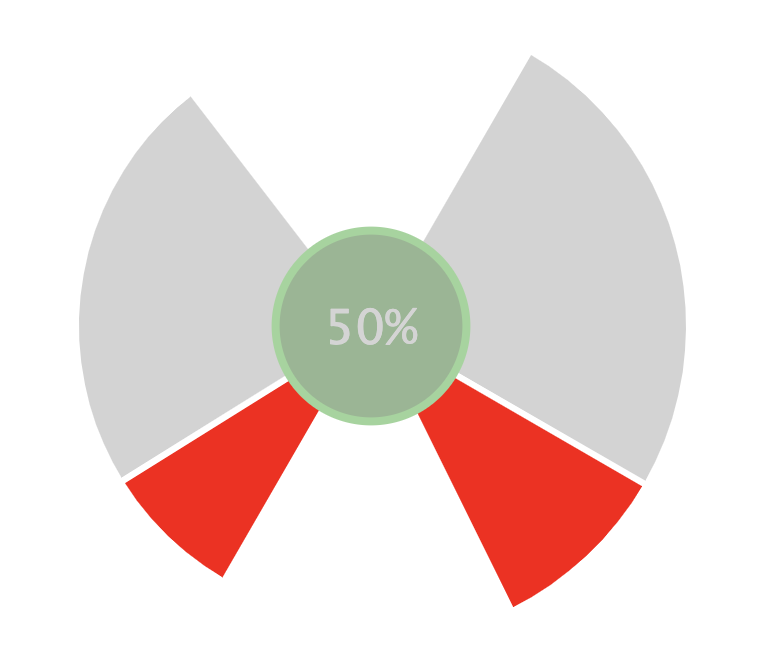
是否可以使用高图表在圆的左右绘制这类量规?基本上,左边是代表短裤的百分比年龄在左边,右边是代表短裤的百分比年龄在右边,中间是一个简单的圆圈,中点投篮的年龄是%。
回答 1
Stack Overflow用户
发布于 2021-12-21 10:28:39
系列变量饼,它看起来更适合这种情况。工具提示我们构建了设置useHTML:true,在SVG呈现器呈现的中心圈。
Highcharts.chart('container', {
  chart: {
    events: {
      render() {
        const chart = this;
        if (!chart.customCenterCircle) {
          chart.customCenterCircle = chart.renderer.circle(
            chart.plotLeft + chart.plotSizeX / 2,
            chart.plotTop + chart.plotSizeY / 2,
            0
          ).add().toFront();
        }
        if (!chart.customCenterText) {
          chart.customCenterText = chart.renderer.text('50%', 0, 0).css({
            fontSize: '24px',
            color: '#d4d4d4'
          }).add().toFront();
        }
        chart.customCenterCircle.animate({
          x: chart.plotLeft + chart.plotSizeX / 2,
          y: chart.plotTop + chart.plotSizeY / 2,
          r: chart.series[0].center[3] / 2,
          fill: 'rgba(31, 112, 31, 0.5)',
          stroke: 'rgba(154, 214, 154, 1)',
          'stroke-width': 4
        });
        chart.customCenterText.attr({
          x: chart.plotLeft + chart.plotSizeX / 2 -
            chart.customCenterText.getBBox().width / 2,
          y: chart.plotTop + chart.plotSizeY / 2 -
            chart.customCenterText.getBBox().y -
            chart.customCenterText.getBBox().height / 2
        });
      }
    }
  },
  tooltip: {
    backgroundColor: '#ffffff',
    borderWidth: 0,
    useHTML: true,
    formatter: function() {
      return `<p><h1 style="color:${this.color};">${this.y}</h1></br>${this.key}</p>`
    }
  },
  series: [{
    type: 'variablepie',
    minPointSize: 0,
    innerSize: '30%',
    startAngle: 30,
    dataLabels: {
      enabled: false
    },
    borderWidth: 3,
    zMin: 0,
    data: [{
      y: 80,
      z: 100,
            name: 'other',
      color: 'black'
    }, {
      y: 30,
      z: 100,
            name: 'missed right',
      color: 'red'
    }, {
      y: 50,
      z: 0
    }, {
      y: 25,
      z: 80,
            name: 'missed right',
      color: 'red'
    }, {
      y: 75,
      z: 80,
            name: 'other',
      color: 'black'
    }, {
      y: 60,
      z: 0,
            name: 'other',
    }]
  }]
});
现场演示: https://jsfiddle.net/BlackLabel/sc9vwzjt/2/
API引用:
https://www.highcharts.com/docs/chart-and-series-types/variable-radius-pie-chart
https://api.highcharts.com/highcharts/series.variablepie
https://api.highcharts.com/class-reference/Highcharts.SVGRenderer
页面原文内容由Stack Overflow提供。腾讯云小微IT领域专用引擎提供翻译支持
原文链接:
https://stackoverflow.com/questions/70431345
复制相关文章
相似问题
腾讯云开发者

Copyright © 2013 - 2026 Tencent Cloud. All Rights Reserved. 腾讯云 版权所有
深圳市腾讯计算机系统有限公司 ICP备案/许可证号:粤B2-20090059  粤公网安备44030502008569号
腾讯云计算(北京)有限责任公司 京ICP证150476号 | 京ICP备11018762号